

Author: Ideon

Why provider address data is broken — and how Ideon’s address confidence scores fix it
Posted on by Ideon

Provider directories have a well-documented accuracy problem. Health plans publish addresses for millions of providers, but a significant portion are outdated, duplicated, or simply wrong. For any platform that depends on this data — whether for care navigation, plan shopping, or in-network provider search — the result is a broken user experience: members directed to offices that no longer exist, calls to disconnected numbers, and eroded trust in the tools meant to help them.
Ideon's Address Confidence Score is a direct response to this industry-wide challenge, built into IdeonSelect, Ideon's provider network data API.
The core problem: directories are slow to shrink
Health plan provider directories grow faster than they are cleaned up. New provider-address records are added regularly as providers join networks, open new locations, or update their credentials. But stale records — old addresses, closed offices, providers who've left a network — are removed at a much slower rate. The result is a directory structurally biased toward accumulating outdated data over time.
This isn't a failure of any single health plan. It's an artifact of how directories are maintained across the industry. And it's why even well-resourced platforms that pull directly from carrier sources still encounter inaccurate location data at scale.
What address confidence scores do
Ideon's Address Confidence Score assigns a High, Medium, or Low rating to every provider address in its dataset — covering more than 19 million unique addresses across 3 million individual providers. The scores reflect the likelihood that a provider is actually practicing at a given address, based on a machine learning model trained on manually verified data.
| Score | What it means | Validation rate (in testing) | Recommended display action |
|---|---|---|---|
| High | Provider is very likely practicing at this address | >85% confirmed valid | Show prominently; sort first |
| Medium | Roughly a coin flip on whether the provider sees patients here | ~50% confirmed valid | Show with optional caveat flag |
| Low | Provider is very likely not at this address | >93% confirmed invalid | Filter out when High alternatives exist; show with strong caveat otherwise |
| Unscored | Only one carrier source exists for this provider — insufficient signal | Treat as Medium | Show with same caveat as Medium |
Ideon built the verification dataset underlying the model by directly calling a statistically significant, representative sample of providers to confirm addresses — then split that data into training and test groups to develop and validate a predictive model.
How the model works
Two factors emerged as the strongest predictors of address accuracy across the full provider network dataset:
Frequency
How often does this address appear across Ideon's carrier data sources over time? Ideon ingests data from more than 600 carrier sources, accounting for billions of provider addresses. An address that consistently appears across many sources and recent refreshes is much more likely to be accurate than one that surfaces only occasionally or from a single source. Recency is factored in — a frequent address from an older refresh carries less weight than a frequent address from a current one.
Distance
How far is this address from the weighted center point of all addresses associated with the provider? Ideon calculates a weighted geographic center based on all addresses for a given provider (identified by NPI), then evaluates each address against that center. Addresses that are geographically anomalous relative to a provider's known practice locations score lower.
Note: Scores are applied only to individual providers (defined by the type field in Ideon's dataset). Provider organizations and facilities are excluded from scoring.
Score distribution: what to expect
Slightly more than half of all provider addresses score Low. That reflects the structural issue described above — directories accumulate stale records over time. It also reflects variation across carrier sources: some health plans maintain much more accurate directories than others.
| Dimension | What varies | Detail |
|---|---|---|
| Overall distribution | ~50%+ score Low; most of the remainder score High | Consistent across all products and markets in Ideon's dataset |
| By carrier source quality | Most accurate carriers: >50% High; least accurate: >75% Low | Source quality varies significantly across health plans |
| By specialty — highest scored | Psychology, pediatrics, family medicine | Stable practice locations drive consistent address signals |
| By specialty — lowest scored | Radiology, anesthesiology | Itinerant practice patterns generate many addresses, most stale |
How to implement address confidence scores
For most member-facing provider search applications, Ideon recommends a dynamic filtering approach at two levels. Full implementation guidance is in the Address Confidence Score documentation.
Provider level — for each provider returned in a search
- If a provider has addresses at multiple confidence levels (High + Medium + Low, or Medium + Low), filter out the Low addresses
- If all of a provider's addresses are Low, keep them — don't drop the provider entirely
- Sort displayed addresses with High-confidence addresses first
Search level — across all providers returned
- If enough High-confidence providers meet your volume threshold, deprioritize providers with only Medium or Low addresses
- If not enough High-confidence providers are available (common in rural areas), surface the remaining providers anyway
- Use Address Confidence Score as a factor in your provider-level sorting algorithm
Ideon also recommends showing a warning flag or UI notification when Medium or Low-confidence addresses are displayed — giving users the context they need to verify before traveling to a location.
Why this matters for care navigation platforms
For platforms helping members find in-network care, bad address data doesn't just create friction — it creates a trust problem. A member who travels to a provider's listed address and finds an empty office is unlikely to rely on that tool again.
Address Confidence Scores give platforms a systematic, data-driven way to surface the most reliable location information first, while still returning results in low-density areas where aggressive filtering would leave users with nothing. The scoring is available via the IdeonSelect provider search response alongside all other provider data — network participation, specialties, and cost and quality ratings — with no separate data pipeline required.
Frequently asked questions
What is a provider address confidence score?
A provider address confidence score is a data quality rating — High, Medium, or Low — that indicates the likelihood a healthcare provider is actually seeing patients at a given address. Ideon's Address Confidence Score is generated by a machine learning model trained on manually verified data, using address frequency across 600+ carrier sources and geographic distance from a provider's known practice locations as the two primary signals.
How accurate are the scores?
In testing against manually verified data: High addresses were confirmed valid more than 85% of the time. Medium addresses were valid roughly 50% of the time. Low addresses were confirmed invalid more than 93% of the time.
Why do so many addresses score Low?
Provider directories accumulate stale records over time because new entries are added faster than outdated ones are removed. This structural bias means slightly over 50% of addresses in Ideon's dataset score Low — concentrated in old or single-source records.
Should I filter out all Low addresses?
No. Filtering all Low addresses can eliminate providers in rural areas or networks with lower-quality directories, leaving users with no results. Ideon's recommended implementation uses dynamic filtering: remove Low addresses when High alternatives exist for the same provider, but preserve them when they're the only data available.
Explore the full technical documentation for Address Confidence Scores in Ideon's API guide, including field definitions and response examples for the provider search response. To learn about IdeonSelect and how it powers provider search for care navigation platforms, visit ideonapi.com/ideon-select.
Data for multi-carrier ICHRA quoting, delivered via a single API
Posted on by Ideon
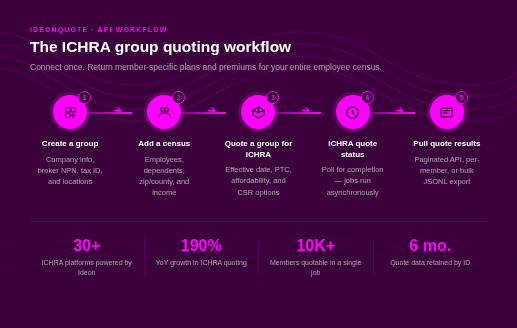
If you’re building an ICHRA platform, getting fast, accurate quotes from every major carrier is table stakes — and one of the hardest technical problems to solve on your own. IdeonQuote gives benefits platforms a single API connection to access multi-carrier ICHRA quoting data for entire employee populations, including premiums, affordability calculations, and plan details, without building or maintaining a proprietary rating engine.
Ideon powers the quoting and plan selection experience for 30+ ICHRA platforms. In the last year alone, ICHRA quoting volume across the Ideon network has grown 190% year-over-year. If you’re building an ICHRA quoting experience, here’s how the API works and what it gives you.
The problem with multi-carrier ICHRA quoting
ICHRA has a structural complexity that most benefits products don’t. Unlike traditional group coverage, each employee shops the individual market based on their own location, household size, age, and income. That means a single employer group can have employees in dozens of states, each needing quotes across a different set of carriers and plans.
Building this yourself means negotiating data feeds with individual carriers, normalizing wildly inconsistent data formats, keeping rates current throughout the plan year, and handling edge cases like CSR eligibility and affordability calculations — all before you can show a single employee their options.
Most platforms that try to build proprietary rating engines underestimate the ongoing maintenance burden. Carrier relationships change. Rate files update. Compliance requirements shift. What looks like a one-time build becomes a permanent engineering dependency. (For a deeper look at this tradeoff, see How to build an ICHRA platform via API.)
How IdeonQuote solves it
IdeonQuote provides a single API connection to comprehensive individual-market plan and rate data across carriers — normalized, maintained, and ready to query. For ICHRA specifically, the API supports group-level quoting: you submit the full employee census once, trigger a single quote job, and get back member-specific plan availability and premiums for the entire group.
The API handles the carrier data relationships, rate normalization, and calculation logic on Ideon’s side. Your team integrates once and focuses on building the experience for your customers.
How the ICHRA group quoting workflow works
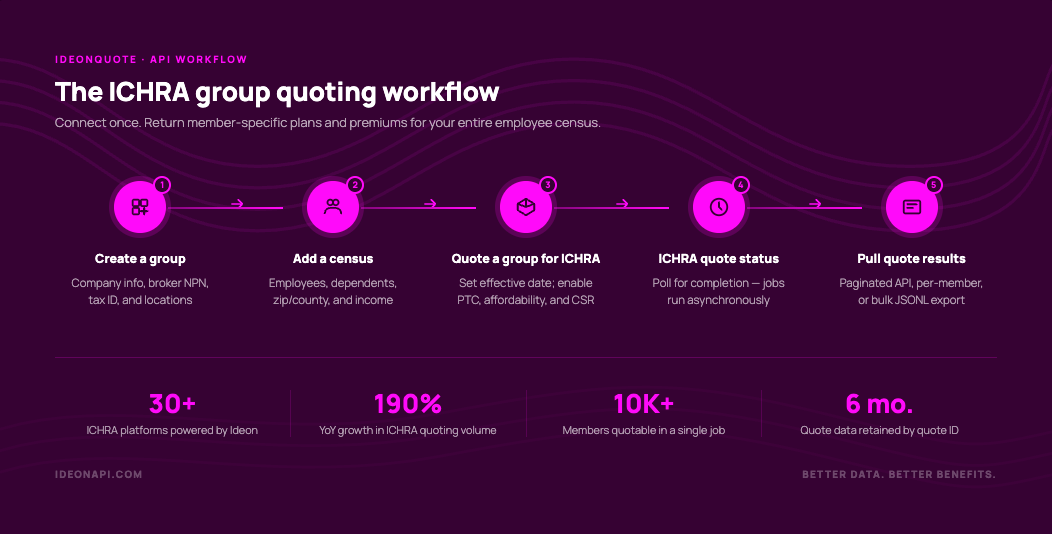
The IdeonQuote ICHRA workflow is five steps. Quote jobs process asynchronously, so your application doesn’t block while rates are being calculated. Full technical documentation is available in Ideon’s API docs.
1. Create a group
Set up a group resource with company information, broker/agency NPN, tax ID, and office locations. The group resource is reusable — if the underlying data doesn’t change, you can run multiple quotes against the same group ID without recreating it.
2. Add a census
Upload the full employee census, including each member’s zip code, county, date of birth, household dependents, and — if you’re running affordability calculations — annual income. The census can include groups ranging from a handful of employees to 10,000+ members.
3. Trigger the quote
Submit a quote request against the group ID with an effective date. At this step you can also enable optional calculations: Federal Premium Tax Credit (PTC) eligibility, ICHRA affordability (minimum employer contribution based on income and FPL), and Cost Sharing Reduction (CSR) eligibility. You can also apply plan filters — for example, scoping results to specific issuers or exchange-only plans — if your use case doesn’t require the full market view.
4. Check quote status
Quote jobs process in the background. Processing times scale with group size: approximately 15 seconds for 100 members, 2 minutes for 1,000, and 20 minutes for 10,000. Poll the status endpoint until the job completes.
5. Pull results
Retrieve quoted rates and calculation outputs in the format that fits your workflow. For smaller groups, paginate through the full member result set via the API. For larger populations, download a JSONL bulk export file with all member data. You can also pull results for a single member on demand — useful for re-quoting after minor census changes.
What the quote response includes
For each member in the group, the API returns:
- Available plans and premiums — member-specific rates across all eligible individual-market plans, including age-banded breakdowns per applicant when enabled
- ICHRA affordability — the minimum employer contribution calculated against each member’s income (safe harbor) and the federal poverty line
- PTC subsidy eligibility — each member’s estimated premium tax credit and CHIP/Medicaid eligibility
- CSR eligibility — whether the member qualifies for cost-sharing reduction plan variants, with CSR plans automatically included in the rates array when eligible
- Plan HIOS IDs — unique plan identifiers that link directly to Ideon’s cached plan benefit data, so you can surface complete plan details to employees without additional carrier calls
For plan-level details like benefits, deductibles, and network information, Ideon provides bulk export files that can be cached on your side and updated on a daily or weekly cadence. This approach enables a fast, real-time quoting experience for employees without latency from live plan lookups on every request. See the full API reference documentation for schema details.
Scale and coverage
IdeonQuote is built to handle the geographic complexity that defines ICHRA. Individual-market availability varies by state and county — an employee in rural Ohio has a different carrier set than an employee in downtown Austin. The API accounts for this automatically, returning member-specific plan availability based on each person’s location in the census. For context on which carriers participate where, Ideon’s data covers individual-market availability down to the state and county level.
The workflow scales from small employers to large populations without changing your integration. A census of 10,000 members processes the same way as a census of 50 — you upload, trigger, and pull.
Quote data is retained and accessible via quote ID for six months after creation, giving you a consistent reference point for employer reporting, re-quoting, and support workflows.
Who's building with IdeonQuote
Ideon powers ICHRA quoting and other features for 35+ ICHRA administration platforms, including Gravie, Take Command, Zizzl, Remodel Health, and others. Nationally, Ideon added approximately 10 new ICHRA platforms to its network in 2025 alone, with strong continued interest from new administrators and brokers building their own quoting experiences. Learn more about Ideon’s ICHRA infrastructure.
Beyond quoting: the full ICHRA data stack
Quoting is where the ICHRA platform experience starts, not where it ends. Ideon’s products cover the full workflow:
- IdeonSelect — real-time provider network data from 300+ carriers, so employees can check if their doctors are in-network before they choose a plan
- IdeonEnroll — automated enrollment and member update submissions to carriers, replacing point-to-point integrations with a single connection
- Payments — automated premium payment submission to carriers on behalf of ICHRA enrollees
Most ICHRA platforms using IdeonQuote for plan and rate data expand into IdeonSelect and IdeonEnroll as their product matures. Connecting once to Ideon’s infrastructure gives you a path to all four products without rebuilding your carrier data architecture.
Frequently asked questions
What is ICHRA quoting data?
ICHRA quoting data is the set of individual-market health plan options, premiums, and eligibility calculations — like ICHRA affordability and PTC subsidies — that an ICHRA platform needs to show each employee their coverage options and help employers set appropriate contribution amounts. Ideon provides this data via API, aggregated across carriers and normalized into a consistent schema.
How do ICHRA APIs improve connections between administration platforms and carriers?
Rather than each platform building and maintaining direct data feeds with individual carriers, an ICHRA API like IdeonQuote centralizes that connectivity. Platforms integrate once with Ideon, and Ideon manages the carrier relationships, rate normalization, and data freshness. This eliminates duplicated integration work across the industry and reduces the operational burden on both platforms and carriers.
What data and integrations power an ICHRA platform?
A complete ICHRA platform typically needs four types of data: (1) individual-market quoting data to show plan options and premiums, (2) provider network data so employees can check doctor availability, (3) enrollment connectivity to submit applications and member changes to carriers, and (4) payment infrastructure to route premiums from employees to carriers. Ideon’s products — IdeonQuote, IdeonSelect, and IdeonEnroll — cover all four.
How do I get ICHRA quotes from every carrier?
Through a single Ideon API connection. IdeonQuote aggregates individual-market plan and rate data across carriers into one normalized API. You submit the employee census, trigger a quote job, and retrieve member-specific results without building or maintaining separate carrier integrations. Full documentation is in Ideon’s Quote and Select API guide.
Can IdeonQuote handle large employee populations?
Yes. The ICHRA group quoting workflow is designed to scale. A group of 10,000 members processes in approximately 20 minutes asynchronously, and the results can be retrieved via paginated API response or bulk JSONL export. There is no need to change your integration approach as your customer base grows.
Does IdeonQuote include ICHRA affordability calculations?
Yes. When enabled at quote time, the API returns minimum employer contribution amounts for each member based on their income and the federal poverty line. These calculations are included in the member-level rate response alongside plan premiums and are available for groups of any size.
Get started
Benefits platforms and ICHRA administrators that want accurate, multi-carrier ICHRA quoting data without building a proprietary rating engine connect to IdeonQuote. Explore the API documentation or contact Ideon to discuss your ICHRA quoting use case
ICHRA enrollment tripled in 2025. Here’s the opportunity most GAs are still leaving on the table.
Posted on by Ideon

Carriers are all-in on ICHRA. Employers are asking about it. Brokers know they need to offer it. The GAs that make it easy are going to win the most loyal broker books in the market.
ICHRA enrollment tripled from 2024 to 2025. Among large employers — companies with 100 or more employees — ICHRA adoption grew 49% year over year. Among small employers, it was up 52%. Over the last five years, ICHRA participation has grown more than 1,000%.
This isn’t a trend to watch anymore. It’s a market shift to navigate.
The signal from carriers is equally clear. Oscar Health is exiting traditional small-group health insurance specifically to concentrate on ICHRA, calling it out in investor presentations as a primary growth driver for the next three years. Centene launched Ambetter Health Solutions — a dedicated ICHRA division — with off-exchange ICHRA plans now available in 13 states. Highmark is making similar moves. The carriers who know the individual market best are betting on ICHRA as the future of employer-sponsored coverage for the small and mid-market.
So the question for general agencies isn’t whether ICHRA is real. It is. The question is whether your GA is positioned to capture it — or whether you’re watching the opportunity flow to the brokers, platforms, and carriers that got there first.
Why most brokers aren't capturing their ICHRA opportunity
92.8% of brokers say they believe ICHRA adoption will increase significantly over the next five years. And yet two-thirds of brokers currently selling ICHRA have five or fewer clients.
The gap between expectation and execution is a tool problem, not a motivation problem.
Selling ICHRA to an employer group requires, at minimum: comparing ICHRA contribution amounts against individual market premiums by employee ZIP code; assessing network access at the employee level; modeling subsidy eligibility for employees who qualify; and benchmarking total employer cost against fully-insured and level-funded alternatives — all in one output the broker can actually show an employer.
On a standard fully-insured renewal, most of that work is automated. A broker submits a census, a quoting platform returns structured options, and the comparison is ready to present.
On an ICHRA evaluation today, almost none of it is automated at the GA level. Brokers pull individual market premiums from a separate platform. They model subsidy eligibility in spreadsheets. They reconcile the ICHRA output against a group quote that lives in a different system. They build the recommendation by hand — across multiple tools that don’t talk to each other.
Brokers know they should be offering ICHRA on qualifying renewals. But when the analysis takes most of an afternoon, they run it on the deals where someone explicitly asked. They skip it on the renewals where surfacing ICHRA proactively would require extra work. The opportunity goes uncaptured — not because it isn’t there, but because the tools to find it efficiently don’t exist in their GA workflow.
What a GA-level ICHRA capability actually looks like
The GAs that have successfully scaled broker ICHRA practices share specific capabilities that separate them from firms where ICHRA is still a special-request workflow.
Proactive ICHRA flagging on qualifying renewals
The most important shift isn’t the analysis itself — it’s when the analysis happens. GAs that win on ICHRA surface the opportunity at the start of a renewal, not after a broker asks.
The criteria for flagging are well-established: groups in high-adoption states (Texas, Florida, Georgia, North Carolina, Tennessee, Indiana, Arizona); employer sizes in the 10–200 life range where individual market premiums are most competitive; and groups with geographic dispersion across multiple ZIP codes where ICHRA’s flexibility is most valuable.
When ICHRA eligibility surfaces automatically as part of a renewal intake, running the comparison costs a broker a few minutes. When they have to decide whether to initiate the analysis manually, it costs an afternoon. Most skip it. Proactive flagging removes that decision — and changes how often ICHRA gets onto the employer’s table.
A unified comparison across funding models
The clearest gap in the GA broker tool market today is the absence of a single output that shows fully-insured, level-funded, and ICHRA side by side, with enough structure that a broker can walk an employer through it in a meeting.
Today, those three analyses live in three different systems. Brokers who want to present a complete picture build it manually — pulling data from a group quoting platform, a level-funded carrier portal, and a standalone ICHRA platform, then reconciling the numbers into a coherent comparison format.
GAs that eliminate that manual step give brokers a meaningful capability advantage on every deal where ICHRA or level-funded is relevant — which, in the current market, is nearly every group renewal.
Employee-level network analysis for ICHRA plans
The objection brokers hear most on ICHRA is about doctors: “My employees want to keep their current providers. Can they do that on an individual market plan?”
Answering this confidently requires individual market plan data at the ZIP level and provider network data for each plan option — so a broker can show, specifically, which ICHRA-eligible plans in that market preserve the group’s existing provider relationships and which don’t.
This is the piece that turns an ICHRA conversation from a concept into a recommendation. Without it, the broker presents contribution amounts and premium ranges. With it, the broker presents a specific plan recommendation, backed by network fit data, that an employer can act on.
The carrier investment signal is worth taking seriously
It’s one thing for an emerging benefit structure to grow on the demand side. It’s another when the largest carriers in the individual market reorganize around it.
Oscar Health’s decision to exit small-group insurance was explicit: the company sees ICHRA as a better long-term opportunity for its individual market expertise than competing in traditional group. Ambetter/Centene didn’t just add ICHRA plans — they built a dedicated organizational structure around ICHRA distribution, with plans available across Arizona, Florida, Georgia, Indiana, Kansas, Mississippi, Missouri, Nebraska, Ohio, Oklahoma, South Carolina, Tennessee, and Texas. Highmark is making similar strategic moves into the ICHRA market.
These are carriers that know individual market enrollment, provider network dynamics, and state-by-state plan design better than anyone. When they restructure business units around ICHRA, it’s a durable market signal — not a feature addition.
The practical implication for GAs: the ICHRA-specific plan data landscape is getting more complex, not less. Ambetter’s ICHRA plans have different designs and pricing from its standard ACA plans. Oscar’s ICHRA offerings are built around a distinct member experience model. Tracking and normalizing this data — across carriers, states, and plan years — is increasingly important for any GA that wants to surface ICHRA as a real option, not just an abstract alternative.
The employer retention data makes the opportunity concrete
One of the strongest signals in the ICHRA data is retention: 92% of employers who offered an HRA in one year continued to offer it the next. That’s a sticky benefit model.
Brokers who help an employer implement ICHRA own a long-term relationship — not just a renewal. The employer is counting on them to manage contribution strategy year over year, navigate carrier and plan changes each open enrollment period, and help employees make sense of their individual market options. That’s a fundamentally deeper advisory role than a group insurance renewal creates.
For GAs, this translates directly: the broker who closes an ICHRA deal with GA support is more dependent on that GA than a broker who closes a fully-insured renewal. The analysis, the ICHRA-specific carrier relationships, the network data — those capabilities live at the GA layer, and they make the broker relationship stickier in both directions.
What the data infrastructure challenge actually looks like
The capability gap isn’t about training brokers on ICHRA. Most brokers who’ve been exposed to it understand the mechanics. The gap is infrastructure — and it lives at the GA level.
Running a meaningful ICHRA comparison requires:
- Individual market plan and premium data at the ZIP level, structured by employee demographics and family composition
- Subsidy eligibility modeling by employee income band
- ICHRA-specific carrier plan data — including the dedicated plan designs from Ambetter, Oscar, and others built specifically for ICHRA distribution
- Provider network data for individual market plans, at the granularity required to compare against a group’s existing provider relationships
Most GAs don’t have this data in one place. They have group plan data in their quoting infrastructure and ICHRA data outside it — which means every ICHRA comparison requires a context switch, a manual reconciliation, and a slower recommendation cycle.
The GAs closing this gap are doing so through the data layer: normalizing individual market, level-funded, and group plan data into a single source so comparison can be automated. That architecture change is what separates GAs where ICHRA is a niche offering from GAs where it’s a standard part of every qualifying broker conversation.
Frequently asked questions
Q:What states have the highest ICHRA adoption in 2026?
ICHRA adoption is highest in states where individual market premiums are most competitive relative to group rates: Texas, Florida, Georgia, North Carolina, Tennessee, Indiana, and Arizona are the top markets. These are also the states where Ambetter, Oscar, and other carriers have concentrated their ICHRA-specific plan investments.
Q:Why are most brokers still stuck at five ICHRA clients?
The primary constraint is workflow friction. ICHRA analysis today requires multiple tools and manual reconciliation across systems that don’t connect. Brokers run it on deals where someone explicitly asks. GAs that integrate ICHRA comparison natively into the broker workflow remove that friction — and change how often ICHRA gets onto the employer’s table.
Q:What’s the difference between ICHRA and level-funded insurance?
ICHRA is an employer-funded benefit where employers provide employees a fixed monthly allowance to purchase individual market health insurance. Level-funded is a small group arrangement structured like self-insurance but with predictable monthly costs and stop-loss coverage. They serve different employer profiles and aren’t interchangeable — a complete GA broker tool surfaces both alongside fully-insured options in a unified comparison.
Q:Why are carriers like Oscar and Ambetter restructuring around ICHRA?
Both carriers have individual market expertise that translates well to ICHRA — strong state-level plan design, enrollment infrastructure, and provider networks suited to individual market members. ICHRA brings employer volume to the individual market without the rating restrictions and participation requirements of group insurance. For carriers positioned in the individual market, it’s a natural growth path.
Q:How can a GA surface ICHRA proactively on every qualifying renewal?
Proactive ICHRA flagging requires structured eligibility criteria — employer size, state, current premium benchmark — combined with individual market data that makes a quick comparison available before a broker initiates the analysis manually. GAs with API-based individual market data can build this flag into their intake workflow so it surfaces automatically on qualifying groups.
What Ideon provides
Ideon is the data infrastructure that powers ICHRA comparison, network disruption analysis, and cross-funding-model tools for GAs and benefits platforms.
Ideon’s data layer covers individual market plan and rate data across all 50 states; structured ICHRA-specific carrier data including dedicated ICHRA plan offerings from Ambetter, Oscar, and others; level-funded product data; and provider network data for 300+ carriers and 8.5M providers.
GAs building ICHRA comparison and cross-funding-model capabilities on Ideon’s API launch in 6–12 weeks rather than 12–18 months. The data infrastructure is already built, maintained across 50 states, and updated as carrier ICHRA plans evolve each plan year.
If ICHRA is a capability you’re trying to move from “we do this on request” to “we do this on every qualifying deal,” a walkthrough of Ideon’s data and API is the right starting point.
How General Agencies Build Broker Tools That Win in 2026
Posted on by Ideon

A practical guide to network analysis, ICHRA comparison, and funding-model tools — and what each actually takes to build
The gap between a quote and a recommendation is where brokers get differentiated. It’s also where most general agencies stop.
GA broker portals have improved significantly over the last five years. Most mid-to-large GAs now give brokers digital census submission, carrier comparison, and proposal output. That work is real, and it matters. But it stops at the price. And in 2026, price alone isn’t enough to keep a broker from asking whether they need you.
The GAs pulling ahead are building something different: tools that let brokers give employers defensible recommendations, not just quotes. Network disruption analysis. Network-fit intelligence that tells a broker whether a plan is actually right for a specific group. Cross-funding-model comparison that includes ICHRA alongside level-funded and traditional group.
This is a practical look at what those tools are, what building them actually requires, and where the data challenge lives — for any GA evaluating whether and how to invest.
Organizations with advanced network analytics capabilities consistently outperform peers. They identify high-performing providers, predict adequacy gaps before they become regulatory violations, reduce medical costs through smarter network design, and adapt rapidly to changing market dynamics. Those without analytics remain stuck in reactive cycles—addressing issues only after members complain, regulators intervene, or costs escalate.
This guide explores what healthcare provider network analytics encompasses, why it has become a competitive necessity in 2026, and how modern analytics platforms and API-driven data infrastructure allow organizations to optimize networks in minutes rather than months. In a healthcare landscape where network performance directly drives financial results and member outcomes, analytics is no longer a technical upgrade—it is a strategic imperative.
What brokers actually want from their GA
Before building anything, it’s worth being clear about what brokers are asking for. Three capabilities come up consistently when brokers describe what would make their GA more valuable.
1. Network disruption analysis
The ability to tell an employer: “If you switch to this plan, here’s the percentage of your employees who will lose their current doctors.”
This analysis has historically been available only to large-group consultants with access to specialized carrier contracts or supplemental data vendors. It almost never reaches the broker in the small-group market. Despite disruption analysis APIs existing since 2019, no major GA currently offers this capability as a standard, integrated part of its broker workflow — the data infrastructure required has kept it out of reach for most GA builds.
For a broker advising a 50-person company whose employees have established specialists and long-standing PCPs, this is a material recommendation-changer. The broker who can produce that analysis — automatically, not on request — is far harder to replace than one who can produce the same quote.
2. Network-fit intelligence
Disruption analysis answers one specific question: will my employees keep their doctors? Network-fit intelligence answers a broader one: is this network actually good enough for this group?
These are related but distinct capabilities. Network-fit analysis looks at plan networks from the group’s perspective — not just whether current providers are in-network, but whether the network has adequate specialist coverage in the ZIP codes where employees live, whether hospital access meets the group’s needs, and how network quality compares across the plans on the table.
This is a capability large-group consultants have offered for years through tools like Zelis, Garner Health, and Healthcare Bluebook. At the small-group GA level, it essentially doesn’t exist in a broker-facing digital form. The broker who can hand an employer a network-quality analysis — not just a list of in-network providers, but a clear read on whether this network is the right fit for your people — is operating at a different level of advisory than the one presenting only premiums.
3. Cross-funding-model comparison — including ICHRA
Today, a broker who wants to show an employer a side-by-side comparison of fully-insured, level-funded, and ICHRA options has to build that view manually — carrier portals, spreadsheets, a separate ICHRA platform. The three analyses live in three different systems, normalized by hand.
GAs that produce this comparison automatically give brokers a capability the market is still largely building by hand. 37% of covered workers at small firms are already in level-funded arrangements (KFF, 2025). ICHRA enrollment tripled from 2024 to 2025. Major carriers have made ICHRA a strategic priority: Oscar Health is pivoting away from traditional small-group to focus on ICHRA; Ambetter/Centene launched a dedicated ICHRA division and off-exchange ICHRA plans across 13 states. Employers are asking about both options. Brokers who can compare them fluently against traditional group win more of those conversations.
What building each tool actually requires
The user experience for each of these capabilities isn’t the hard part. The hard part is the data.
Network disruption analysis
You need two things: structured data on each employee’s current providers, and structured network data for every plan in the comparison.
The employee-provider data usually comes from a census or HR system. The plan network data has to come from somewhere else — either direct carrier relationships, a benefits data platform, or both.
The challenge is normalization. Carrier provider directories arrive in inconsistent formats, with varying NPI data quality and refresh cadences. Building a disruption analysis tool without a clean, normalized provider data layer means accepting data quality problems or investing heavily in data engineering before you can build the feature.
This is why most GAs have discussed offering disruption analysis for years and still haven’t. The concept is straightforward; the data infrastructure is the bottleneck. Any GA that solves this first occupies meaningful white space in the market.
Network-fit intelligence
Network-fit analysis requires a different data foundation than disruption analysis — or a superset of it. You need network adequacy data: how many in-network providers of each specialty exist within a reasonable drive time from employee ZIP codes, whether key hospital systems are included, and ideally some measure of quality or utilization patterns across the in-network provider population.
The structured version of this data — normalized by carrier and market, at the ZIP and county level — is not available from carrier portals in any consistent form. Building it in-house means either working directly with carriers to get network files, purchasing specialty data, or both. For a GA that wants to offer meaningful network-quality insight (not just a lookup tool), the data assembly challenge is similar to disruption analysis: tractable in principle, expensive to build from scratch.
Cross-funding-model comparison
The data requirement expands significantly. You need:
- Fully-insured plan and rate data for the relevant market
- Level-funded product data for every carrier that offers it
- ICHRA-eligible individual market plans with subsidy and premium data by ZIP code and employee demographics
These data sources are structured differently, updated on different cadences, and historically served by different vendors. Stitching them together into a unified comparison output is a data normalization problem as much as a product problem. It’s why the capability barely exists at the GA level even at the largest, most tech-forward firms.
The ICHRA piece adds another layer: you also need structured data for ICHRA-specific plan designs that carriers like Ambetter and Oscar are now bringing to market — plans designed specifically to be purchased through ICHRA allowances, with plan designs and pricing that differ from standard individual market products. That data has to be maintained as carriers update their ICHRA offerings each plan year.
What you're actually deciding when you decide to build
Most GA product roadmap conversations about broker tools come down to one question: do you build the data layer, or do you partner for it?
Building the data layer means establishing direct carrier data feeds, normalizing inconsistently structured plan and network data, maintaining that data as carriers update plans and networks each year, and scaling it as you enter new markets. For a national GA with significant engineering resources, this is a multi-year investment that pays off at scale. For a regional GA, it often isn’t economically viable — the infrastructure cost exceeds what the capability is worth building in isolation.
Partnering for the data layer means you build the product — the workflow, the user experience, the broker-facing features — on top of structured data from a third-party source. The trade-offs are real: you’re dependent on a vendor’s carrier coverage and data quality. But so is the efficiency: you can ship a disruption analysis capability in weeks, not after 18 months of data engineering.
The most important distinction for a GA evaluating this decision is: the differentiation lives in the product experience and the workflow, not in the data infrastructure. The GA that wins broker loyalty is the one that makes the analysis fast, clear, and consistent — not the one that built its own carrier data pipelines. Building on a pre-built data layer is how most teams get to the product work fastest.
The competitive window is still open — but it's narrowing
Network disruption analysis is a useful test case.
Despite being technically available since 2019 — when Vericred (now part of Ideon) launched the first disruption analysis API — almost no GA has built it into a standard, digital broker-facing workflow. Brokers at the largest national firms still don’t reliably receive a disruption score as part of a quote. This is an asset-class gap, not a vendor gap: the data exists, the API exists, the demand from brokers is real, and no GA has claimed the capability at scale.
The same is broadly true for network-fit intelligence and unified cross-funding-model comparison. Major GAs — Warner Pacific, Amwins, Word & Brown — have built strong quoting and proposal tools. None have built integrated network quality analysis or proactive ICHRA-alongside-group comparison into their standard broker workflow.
The GAs who build these capabilities first will have the category to themselves for a window. The ones who wait will be building toward a standard that someone else already set.
Frequently asked questions
Q:What data sources do I need to offer network disruption analysis?
You need structured network data for every plan in the comparison — provider NPIs, addresses, specialties, and acceptance status — plus the current provider relationships for the group’s employees. The plan network data typically comes from a carrier data platform. The employee provider data usually comes from a census or HR feed.
Q:What’s the difference between disruption analysis and network-fit analysis?
Disruption analysis answers a specific question: will this group’s employees lose their current doctors if you switch plans? Network-fit analysis answers a broader one: is this network adequate and high-quality for this group’s needs, regardless of current provider relationships? Disruption analysis requires knowing who employees currently see. Network-fit analysis can be run on any group using ZIP-level network adequacy and quality data.
Q:How long does it take to build a broker comparison tool?
Timeline depends heavily on how the data layer is sourced. GAs building on pre-normalized API infrastructure have shipped initial capabilities in 6–12 weeks. GAs building proprietary carrier data pipelines from scratch typically need 12–18 months to reach production quality at scale.
Q:What’s the difference between a quoting platform and a broker comparison tool?
A quoting platform returns plan options and prices. A broker comparison tool generates a data-backed recommendation: network fit, funding-model appropriateness, disruption risk, employee-level cost impact. The distinction is in the output, not the interface.
Q:Should a GA build or buy the data layer for broker tools?
It depends on scale and in-house technical resources. For most regional and mid-market GAs, partnering for the data layer is more economical than building proprietary carrier data pipelines. The product experience — the workflow, the broker interface, the differentiated features — is where GA-specific value is built. The data layer is the foundation it runs on.
Q:Which states have the highest broker demand for ICHRA comparison tools?
ICHRA adoption is highest in states where individual market premiums are most competitive relative to group rates: Texas, Florida, Georgia, North Carolina, Tennessee, Indiana, and Arizona are among the top markets. These are also the states where Ambetter and Oscar have concentrated their ICHRA-specific plan offerings.
What Ideon provides
Ideon is the data infrastructure that powers network disruption analysis, network-fit intelligence, cross-funding-model comparison, and ICHRA-alongside-group capabilities for GAs and benefits platforms.
Five Takeaways: The Care Navigation Advantage — Accurate Provider Data + Quality Scores
Posted on by Ideon

Provider directory inaccuracy and the gap between "in-network" and "high-value" are two of the most persistent problems in care navigation — and they're rarely solved together. In most platforms today, fixing one still means managing a separate vendor, a separate integration, and a separate data pipeline for the other.
On April 14, Ideon hosted a live webinar with HealthCorum to show how that changes. Moderated by Ideon Senior Account Executive Brian Brock, the session brought together Colin Crihfield, Ideon's Director of Product Management, and Keith Somers, HealthCorum's Chief Revenue Officer and co-founder, for a candid conversation about provider directory accuracy, provider quality scores, and what it takes to build a care navigation experience members can actually trust.
The conversation covered the underlying data challenges, how each company approaches accuracy and quality from different angles, and where the Ideon × HealthCorum partnership creates the most impact for care navigation platforms, benefits decision-support tools, and health plans.
Key takeaways
Provider directory accuracy is an ongoing process, not a one-time fix
Provider directory data is best understood as a living, breathing dataset with high variability. With 400+ carrier sources, daily refreshes, and both automated and manual QA processes, Ideon currently sees roughly one validated discrepancy per 5 million provider searches. ML-powered Address Confidence Scores — covering 19M+ provider addresses — give platforms an additional filter to remove potentially inaccurate provider locations before they ever surface to a member.
In-network status is a threshold, not a recommendation
There's a fundamental opacity in healthcare that doesn't exist in other industries. HealthCorum's provider quality scores — built on claims data across all markets — give platforms the ability to surface not just who's in-network, but who's delivering high-value care. That distinction matters for member outcomes and for ROI calculations.
Provider quality scoring requires rigor, not just ratings
HealthCorum scores 1.5M+ providers and 150K+ facilities using 300+ specialty-specific metrics across Effectiveness, Cost, and Appropriateness. Scores are risk-adjusted — so providers treating sicker populations aren't unfairly penalized — and the methodology is built to be transparent and defensible, not a black box.
A single API can change the equation for data, product, and ops teams
The operational simplicity of a single API is itself a meaningful product improvement — one vendor relationship, one data pipeline, one set of documentation, and the ability to return directory data and quality scores in the same API call. For teams building care navigation or provider search experiences at scale, that consolidation removes real complexity.
The use cases extend well beyond provider search
The session covered referral routing (where bad data causes some of the worst downstream harm), plan selection for ICHRA and benefits platforms (which plan has the strongest providers, not just the most), and market intelligence for health plans evaluating new geographies. Existing Ideon customers can also enable HealthCorum data without a full re-integration — it's designed to layer in.
Watch the webinar recording
Colin and Keith go deeper on the technical approach behind each dataset, walk through real platform use cases, and answer audience questions on topics including network comparison, provider coverage breadth, and how Ideon handles conflicting data across carrier sources.

The Care Navigation Advantage: Accurate Provider Data + Quality Scores · April 14, 2026 · 45 min
Add provider cost and quality scores to your platform
IdeonSelect now delivers HealthCorum provider cost and quality scores alongside accurate directory data — locations, specialties, network participation, and more — through a single API. If you're building a care navigation, provider search, or plan selection experience and want to see how provider directory accuracy and quality ratings work together in practice, contact the Ideon team to schedule a walkthrough.
Webinar Recording and Key Takeaways: The New ICHRA Playbook — Automated Enrollment and Payments
Posted on by Ideon

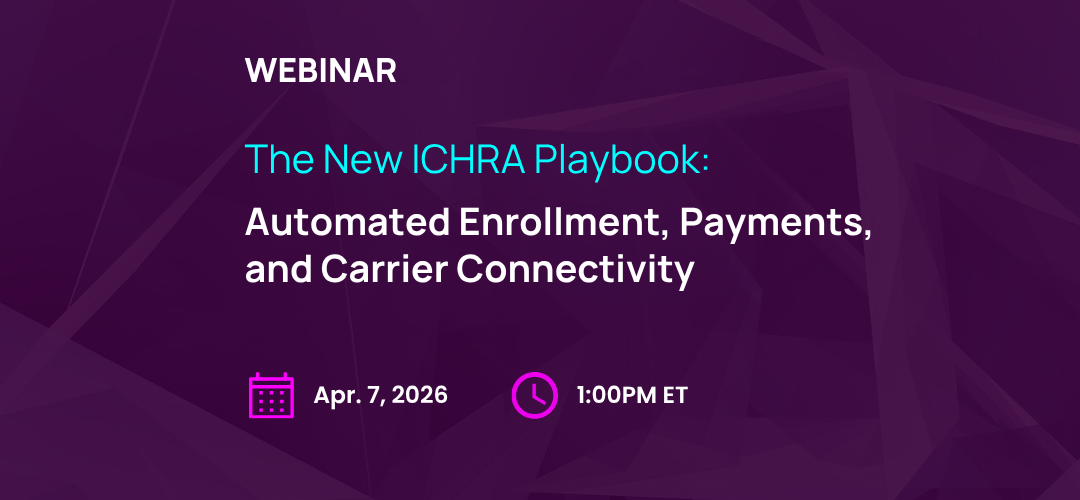
On April 7, 2026, Ideon hosted a live webinar — The New ICHRA Playbook: Automated Enrollment, Payments, and Carrier Connectivity — covering how leading ICHRA platforms and carriers are replacing manual enrollment workflows with fully automated infrastructure. The recording is available below.
In this 30-minute session, Ideon's Dan Langevin, Virginia Giordano, and Matt Rahjes walk through how IdeonEnroll works, what we delivered during OEP 2025, and what's coming next for ICHRA connectivity.
Key topics include:
- Why carrier-by-carrier enrollment and manual data entry can slow ICHRA growth
- How one API integration handles enrollment, payments, reconciliation, attestations, and more across multiple leading carriers
- OEP 2025 results: 5,863 members enrolled, 100% automated
- Recent and upcoming product enhancements, including a single workflow for group ICHRA quoting, network scoring, provider quality ratings, formulary data enhancements, and more
Webinar Replay | The Care Navigation Advantage: Accurate Provider Data + Quality Scores
Posted on by Ideon
Webinar Replay | The New ICHRA Playbook — Automated Enrollment & Payments
Posted on by Ideon
Healthcare Provider Network Analytics: A Complete Guide for 2026
Posted on by Ideon

As value-based care accelerates, regulatory expectations intensify, and competitive pressure increases in 2026, organizations managing provider networks can no longer rely on intuition, spreadsheets, or retrospective reviews. The ability to turn raw claims data and provider information into actionable intelligence now determines whether networks control costs, meet adequacy standards, and deliver high-quality member experiences.
At its foundation, provider network analytics transforms massive volumes of data—millions of claims, provider profiles, utilization patterns, and access metrics—into clear insight about how networks actually perform. Modern analytics goes far beyond counting providers or reviewing quarterly reports. It measures cost efficiency, quality outcomes, access, utilization, and competitive positioning simultaneously, enabling organizations to design and optimize networks with precision rather than guesswork.
Organizations with advanced network analytics capabilities consistently outperform peers. They identify high-performing providers, predict adequacy gaps before they become regulatory violations, reduce medical costs through smarter network design, and adapt rapidly to changing market dynamics. Those without analytics remain stuck in reactive cycles—addressing issues only after members complain, regulators intervene, or costs escalate.
This guide explores what healthcare provider network analytics encompasses, why it has become a competitive necessity in 2026, and how modern analytics platforms and API-driven data infrastructure allow organizations to optimize networks in minutes rather than months. In a healthcare landscape where network performance directly drives financial results and member outcomes, analytics is no longer a technical upgrade—it is a strategic imperative.
Why Network Analytics Is Now a Competitive Necessity
Health plans processing millions of claims annually recognize analytics as strategic differentiator between market leaders and laggards. Organizations with advanced network analytics capabilities identify high-performing providers, predict network adequacy gaps before regulatory violations occur, and optimize provider mix for cost-effective care delivery. The strategic question facing payers, ACOs, and benefits technology platforms: continue manual provider analysis consuming staff time without delivering actionable insights, or adopt comprehensive analytics transforming data into competitive advantage?
Traditional network management relies on quarterly performance reviews, spreadsheet-based provider comparisons, reactive adequacy monitoring, and subjective recruitment decisions influenced by relationships rather than objective data. This approach produces networks with unknown cost efficiency, provider performance gaps invisible until members complain, regulatory compliance risks from inadequate monitoring, and missed opportunities for strategic network optimization.
Healthcare provider network analytics operates differently. Comprehensive platforms enable automated performance measurement across cost, quality, and satisfaction metrics, real-time network adequacy monitoring with predictive gap forecasting, competitive intelligence revealing market positioning and provider overlap, and AI-powered recommendations for network design and provider recruitment. Organizations face infrastructure decision: build analytics capabilities internally requiring significant data engineering investment and 12-18 months development, or leverage existing platforms and API infrastructure deploying in weeks.
Network analytics evolved from nice-to-have reporting to competitive necessity throughout 2026 as value-based care adoption accelerates and regulatory scrutiny intensifies.
What Is Healthcare Provider Network Analytics?
Healthcare provider network analytics: The systematic use of data science, statistical analysis, and business intelligence tools to evaluate provider network performance, optimize network composition, and improve healthcare delivery outcomes through data-driven insights.
Healthcare provider network analytics encompasses provider performance measurement across multiple dimensions including cost efficiency metrics revealing total cost of care per episode, quality indicators tracking clinical outcomes and adherence to evidence-based protocols, patient satisfaction scores measuring member experience, and utilization pattern analysis identifying appropriate versus unnecessary care. Network utilization analysis examines member access patterns showing which providers members actually use versus directory listings, appointment availability tracking wait times and access barriers, referral flow mapping revealing where care happens within and outside networks, and service gap identification highlighting unmet member needs.
Competitive intelligence capabilities provide comparative network positioning showing how organization’s network compares to competitors, market share analysis quantifying provider relationships and member volume, competitor provider network mapping revealing overlap and differentiation opportunities, and strategic recruitment targeting based on competitive gaps. Predictive modeling forecasts network adequacy gaps before regulatory violations occur, cost trend predictions enabling proactive contract negotiations, member needs forecasting based on demographic and utilization shifts, and provider performance trajectories identifying improving versus declining providers.
Claims data analysis processes pattern recognition across millions of claims revealing efficiency opportunities, outlier detection flagging unusual cost or quality patterns requiring investigation, episode grouping enabling accurate cost comparisons, and risk adjustment ensuring fair provider performance comparisons. Organizations transform manual, time-consuming provider analysis requiring weeks of spreadsheet work into automated, self-service analytics delivering insights in three clicks rather than three weeks.
Healthcare provider network analytics sits as strategic decision-making layer for network design and optimization rather than simple reporting function. It provides foundation for value-based care arrangements and risk management by quantifying provider performance objectively. Analytics creates critical infrastructure for competitive positioning and member satisfaction by identifying network strengths and gaps. The function proves essential for regulatory compliance and network adequacy reporting by continuously monitoring rather than scrambling before audits.
Why Healthcare Provider Network Analytics Matters
network decisions that replace guesswork with evidence-based provider selection and network design. Organizations using advanced analytics platforms build high-performance networks in minutes rather than months by simulating hundreds of network configurations and selecting optimal combinations. Leading platforms explore 100+ network configurations per market testing various provider combinations against strategic objectives, dramatically accelerating what previously required months of manual analysis.
Cost containment delivers measurable financial impact through optimized network design. Organizations achieve typical 10% reduction in total medical cost through strategic network optimization balancing access, quality, and cost objectives. These savings compound annually as refined networks steer members to high-value providers. Regulatory compliance shifts from reactive firefighting to proactive adequacy monitoring preventing violations before regulatory agencies identify issues, avoiding penalties and protecting plan ratings.
Members and patient care quality improves when better provider matching based on outcomes data connects members to appropriate specialists. Equitable access to high-quality, affordable care results from analytics revealing geographic and specialty gaps requiring attention. Reduced wait times emerge from capacity analysis identifying providers with availability versus those with 6-month backlogs. Network optimization focusing on member needs rather than provider convenience creates superior experiences.
Provider organizations understand network performance and market position through analytics showing comparative performance against peers. Identifying opportunities for improved contracting and partnerships becomes possible with objective performance data. Data-backed negotiations with payers based on quality and efficiency metrics rather than relationship leverage create win-win agreements. Transparency enables collaborative improvement rather than adversarial contracting.
Market intelligence transforms strategic planning when organizations access comprehensive claims datasets covering 300 million beneficiaries and 10 billion claims enabling market and cohort intelligence at unprecedented scale. Complete Medicare, Medicaid, and Commercial data visibility reveals competitive positioning, market share trends, and expansion opportunities invisible with limited data access. Analytics platforms processing millions of claims identify patterns and opportunities manual analysis would never discover.
Core Components of Network Analytics Systems
Comprehensive Claims Data Integration
Access to Medicare, Medicaid, and Commercial claims datasets provides foundation for meaningful analytics. Platforms with over 2 million physician profiles offering national and regional performance benchmarks enable accurate comparisons. Multi-source data aggregation creates holistic provider performance views impossible with single payer data. High-confidence data results from rigorous cleaning and standardization processes eliminating garbage-in-garbage-out problems plaguing internally-built analytics.
Provider Performance Analytics
Cost and quality metrics include provider efficiency scores comparing total cost of care against peers, effectiveness ratings measuring clinical outcomes for similar patient populations, and total cost of care calculations accounting for downstream services triggered by initial treatment decisions. Clinical activity tracking reveals top procedures providers perform most frequently, conditions they treat successfully, medications prescribed indicating specialty focus, and actual specialties served versus claimed credentials.
Peer group comparisons enable benchmarking against similar providers in same markets controlling for patient mix and local market factors. Patient satisfaction measurements incorporate CAHPS scores from official surveys, member feedback from plan-administered assessments, and experience ratings from various touchpoints. These comprehensive performance views replace limited internal data with market-wide intelligence.
Network Adequacy and Access Analysis
Geographic access evaluation ensures compliance with time and distance standards mandated by CMS, state regulators, and accreditation bodies. Provider-to-member ratio calculations by specialty and county quantify whether sufficient provider capacity exists for member populations. Panel capacity monitoring tracks “accepting new patients” status preventing directories listing providers unavailable to new members. Appointment wait time assessment reveals actual access barriers members face versus theoretical network adequacy on paper.
Competitive Intelligence and Market Analysis
Competitor network composition analysis identifies which providers participate in rival networks revealing differentiation opportunities. Provider overlap identification shows where multiple plans compete for same providers versus exclusive relationships. Market share analysis quantifies claims volume and member attribution across competing networks. Claims volume insights across IDN, ACO, and GPO relationship hierarchies reveal organizational affiliations affecting provider decisions. Provider relationship mapping displays referral pattern analysis showing how care flows within markets.
Predictivenalytics and Optimization
AI-powered network design platforms explore 100+ configurations per network and product in a market, testing provider combinations against cost, quality, access, and member satisfaction objectives simultaneously. Machine learning algorithms recognize patterns in claims data forecasting future trends. Network gap prediction identifies emerging adequacy issues before regulatory violations occur. Provider recruitment targeting uses performance data recommending which providers to pursue based on strategic value rather than availability.
Interactive Dashboards and Visualization
Executive dashboards monitor network performance across key measures with real-time updates replacing quarterly static reports. Intuitive user interfaces enable insights in as little as three clicks eliminating need for data science expertise. Geo-spatial heat maps display provider distribution revealing geographic coverage gaps visually. Real-time performance monitoring with flexible trend analysis shows whether network changes deliver intended improvements.
Key Analytics Use Cases and Applications
Network Design and Optimization
Building high-performing networks that maximize medical cost savings while ensuring member access requires balancing competing objectives. Analytics platforms evaluate network resiliency by testing how well networks withstand provider departures, provider centrality showing which providers are critical connection points, and overall network strength quantifying competitive positioning. Creating tiered network strategies based on objective provider performance data enables value-based network designs steering members to high-performers.
Strategic Provider Recruitment
Identifying high-value providers for network expansion uses comprehensive performance data rather than reputation or relationships. Accelerating closure of network gaps focuses recruitment on actively practicing specialists addressing specific geographic or specialty shortfalls. Simulating potential provider impact on overall network performance before contracting prevents expensive mistakes adding providers who worsen rather than improve network metrics.
Leakage Prevention and Referral Optimization
Tracking referral volumes and trends identifies out-of-network leakage patterns showing where members leave network for care. Understanding where patient leakage occurs by specialty, geography, and condition enables targeted retention strategies. Optimizing referral patterns to keep care within network saves costs and improves care coordination. Analytics revealing why leakage occurs—whether from inadequate network, poor provider performance, or member preference—enables appropriate responses.
Regulatory Compliance Management
Eliminating “ghost providers” inactive in practice but listed in directories uses clinical activity insights proving providers haven’t treated patients recently. Ensuring compliance with federal and state network adequacy regulations requires continuous monitoring impossible manually. Automating network adequacy reviews with actionable market insights transforms compliance from manual burden to automated process. Analytics quantifying adequacy in real-time prevents violations before regulatory agencies identify deficiencies.
Value-Based Care Enablement
Assessing provider quality using NCQA HEDIS measures or CMS MIPS scores enables identification of high-performers for value-based contracts. Identifying providers contributing to 90th percentile quality performance reveals partners for risk-sharing arrangements. Supporting risk-sharing arrangements with performance transparency creates objective basis for shared savings calculations. Analytics tracking outcomes and costs enables continuous improvement in value-based programs.
Revenue Optimization
Using cost and quality metrics to build networks optimized for cost-effective care delivery reduces medical expenses while maintaining quality standards. Reducing unnecessary utilization through network design steering members to appropriate care settings improves margins. Increasing profitability through data-driven network refinement eliminates expensive, low-performing providers while adding high-value partners. Analytics quantifying network efficiency enables strategic decisions balancing growth, margin, and quality objectives.
The Analytics Technology Landscape
Enterprise Analytics Platforms
Comprehensive solutions offer network analytics as part of broader payer analytics suites integrating network, clinical, financial, and operational analytics. Leading platforms including Quest Analytics QES, MedeAnalytics Network Insights, CareJourney, and Milliman MedInsight provide enterprise-scalable solutions across all lines of business and specialties. These platforms offer end-to-end capabilities from data integration through advanced analytics and visualization.
Specialized Network Analytics Tools
Purpose-built solutions focus exclusively on provider network optimization with deep functionality in specific domains. McKinsey Network Designer provides AI-powered network optimization exploring hundreds of configurations. HealthWorksAI NetworkIntel offers Provider Network Scorecards for competitive positioning assessment. LexisNexis MarketView delivers competitive intelligence and market analysis. Specialized tools excel in specific use cases but may require integration with broader platforms.
API-Enabled Data Infrastructure
Real-time data access through unified API connections enables integration with existing healthcare IT systems including HRIS, claims platforms, and benefits administration tools. Normalized provider network data via standardized APIs accelerates analytics deployment by eliminating custom integration work. IdeonSelect provides comprehensive provider directories, network adequacy data, and specialty verification across 300+ carriers through unified API, creating data foundation essential for analytics applications without requiring carrier-by-carrier integration work consuming 12-18 months.
Data Sources and Integration
Proprietary claims databases covering all payer types and business lines provide analytical foundation. Third-party data integrations from trusted sources expand insights beyond internal claims. Provider cost transparency data from official reporting requirements enables accurate cost comparisons. Integration capabilities connecting internal and external data sources create comprehensive analytical views impossible with siloed data.
Organizations face infrastructure decision: build analytics capabilities internally requiring significant data engineering investment, AI/ML expertise, ongoing maintenance, and 12-18 months development time, or leverage existing platforms and API infrastructure deploying in weeks with subscription-based pricing and continuous vendor-managed updates. The build-versus-buy decision parallels network management itself—invest resources in undifferentiated infrastructure or focus on strategic network optimization.
Best Practices for Implementing Network Analytics
Start with Clear Objectives
Defining specific business problems analytics should solve focuses implementation on value delivery. Identifying key performance indicators including cost reduction targets, quality improvement goals, and adequacy compliance requirements establishes success metrics. Establishing baseline metrics for measuring improvement quantifies analytics value and justifies investment. Without clear objectives, analytics implementations produce reports without driving decisions.
Ensure Data Quality and Breadth
Access to comprehensive claims datasets covering Medicare, Medicaid, and Commercial populations provides foundational analytical capability. Prioritizing high-confidence data from multiple validated sources prevents garbage-in-garbage-out problems. Integrating proprietary organizational data with external benchmarks creates complete performance views. Data quality and breadth determine analytical accuracy and actionable insight generation.
Build Cross-Functional Teams
Combining network management, clinical, actuarial, and data science expertise ensures analytics addresses real business problems. Analytics insights must translate to actionable network strategies requiring operational expertise alongside technical capability. Fostering collaboration between technical and operational stakeholders prevents analytics existing in isolation from decision-making. Cross-functional teams bridge gap between data and action.
Leverage API Infrastructure
Using standardized provider data APIs accelerates analytics implementation by eliminating custom carrier integration work. Connecting analytics tools to real-time data sources rather than periodic batch feeds enables continuous monitoring. Continuous data updates versus quarterly refreshes transform analytics from historical reporting to forward-looking intelligence. API infrastructure provides data foundation enabling rapid analytics deployment.
Prioritize User Experience
Selecting platforms with intuitive dashboards requiring minimal training ensures adoption by non-technical users. Enabling self-service analytics for network managers eliminates bottlenecks requiring data science support for every question. Focusing on actionable visualizations over complex statistical reports drives decision-making rather than analysis paralysis. User experience determines whether analytics capabilities translate to business value.
Monitor and Iterate
Continuously evaluating analytics impact on network performance through before-after comparisons validates investment. Refining models based on outcomes and feedback improves accuracy over time. Expanding analytics use cases as organizational maturity grows maximizes platform value. Analytics implementations require ongoing optimization rather than one-time deployment.
How IdeonSelect Enables Network Analytics
IdeonSelect delivers normalized provider network data through unified API infrastructure, creating the data foundation essential for healthcare provider network analytics without requiring organizations to build hundreds of individual carrier integrations. The platform provides comprehensive provider directories, network adequacy validation, and specialty verification across 300+ insurance carriers, enabling analytics platforms to access clean, standardized provider data for performance analysis.
Technical Capabilities:
- Unified Data Access: Single API integration provides normalized provider data from 300+ carriers, eliminating custom carrier-by-carrier development requiring 12-18 months per integration
- Real-Time Updates: Automated refresh cycles ensure provider information reflects current network status without manual verification processes
- Comprehensive Provider Profiles: Practice locations, specialties, credentials, network status, panel capacity, and accepting new patients status across all connected carriers in standardized format
- Network Adequacy Data: Geographic coverage analysis, provider-to-member ratios, and specialty availability supporting compliance automation and adequacy analytics
- Analytics Integration: Clean, standardized data enabling analytics platforms to focus on insights rather than data acquisition and normalization
Measurable Outcomes:
- Weeks implementation instead of 12-18 months building carrier data integrations from scratch
- 300+ carrier coverage through single API versus individual integration efforts requiring massive engineering investment
- Standardized data format eliminating ETL complexity and data quality issues plaguing custom integrations
- Continuous updates managed by Ideon ensuring analytics operate on current rather than stale data
- Analytics acceleration enabling organizations to deploy network analytics rapidly by providing data foundation
IdeonSelect enables benefits platforms, TPAs, and health plans to deploy network analytics capabilities by providing the clean, normalized, comprehensive provider data required for meaningful analysis. Organizations focus analytics investments on deriving insights and optimizing networks rather than wasting resources on data acquisition infrastructure. This API-first approach transforms network analytics from multi-year data engineering projects into weeks-long analytical deployments.
The Future of Network Analytics
Advanced AI and Machine Learning
Increasingly sophisticated predictive models for network optimization will forecast member needs, provider performance trajectories, and market dynamics with greater accuracy. Automated recommendations for provider recruitment and contract negotiations will evolve from suggesting candidates to executing strategies. Natural language processing for unstructured data analysis including provider notes, member feedback, and contract terms will extract insights currently trapped in text.
Real-Time Analytics
Shift from periodic reporting to continuous monitoring will accelerate as streaming data architectures mature. Immediate alerts for network adequacy issues or provider performance changes will enable proactive responses before problems escalate. Live dashboards reflecting current network status will replace quarterly snapshots showing outdated information. Real-time analytics transforms network management from reactive to proactive discipline.
Integrated Care Coordination
Analytics linking network design to care management and population health will optimize entire care continuum. Member-provider matching based on outcomes data will improve satisfaction and clinical results. Closed-loop systems connecting insights to interventions will automatically route members to appropriate providers. Integration across network strategy, care management, and utilization management creates synergies impossible with siloed functions.
Transparency and Consumerism
Public-facing provider performance data will drive member choices as transparency requirements expand. Analytics supporting member decision tools and cost estimators will empower informed healthcare decisions. Increased focus on patient experience metrics in network evaluation will shift networks toward member-centricity. Transparency pressures will force networks to compete on objective performance rather than marketing.
Organizations leveraging advanced analytics optimize networks for better outcomes, lower costs, and equitable care—positioning themselves for competitive success in value-based healthcare landscape where performance determines financial results.
Final Words
Healthcare provider network analytics transforms raw claims data and provider information into strategic intelligence enabling optimized network composition, reduced medical costs, and improved member outcomes. Organizations implementing comprehensive analytics deliver measurable results including 10% medical cost reductions through strategic network design, faster network optimization exploring 100+ configurations in minutes rather than months of manual analysis, and improved regulatory compliance through continuous adequacy monitoring preventing violations before auditors identify issues.
Leading health plans already leveraging advanced analytics gain significant competitive advantages over organizations relying on manual spreadsheet-based network management. The performance gap widens as analytics-enabled organizations continuously refine networks using objective data while competitors make subjective decisions based on incomplete information and relationships. Analytics capabilities separate market leaders from laggards in increasingly competitive healthcare landscape.
Essential capabilities enabling network analytics success include comprehensive claims data covering Medicare, Medicaid, and Commercial populations, provider performance metrics measuring cost, quality, and satisfaction objectively, predictive modeling forecasting network gaps and optimization opportunities, and competitive intelligence revealing market positioning and strategic options. Organizations must decide: build analytics infrastructure internally requiring significant data engineering investment and 12-18 months development, or leverage existing platforms and API solutions deploying in weeks.
Assessing current analytics capabilities reveals baseline performance and improvement opportunities. Organizations processing millions of claims without extracting strategic insights waste valuable assets. Evaluating comprehensive analytics platforms including Quest Analytics, MedeAnalytics, CareJourney, Milliman MedInsight, and API infrastructure solutions like IdeonSelect provides comparison against build-from-scratch approaches. Starting with high-impact use cases including provider recruitment optimization, leakage prevention, or adequacy compliance demonstrates value quickly.
Building cross-functional teams translating analytics insights into network strategy ensures capabilities drive decisions rather than generating unused reports. Network management, clinical, actuarial, and data science expertise working collaboratively transforms analytics from technical exercise to strategic advantage. Organizations treating analytics as technology project rather than business transformation fail to realize value.
Advanced network analytics enables data-driven decisions replacing intuition and relationships with objective performance measurement, optimized provider networks balancing cost and quality rather than simply maximizing provider count, and superior member outcomes through strategic network design—essential capabilities for thriving in modern healthcare landscape where value-based c
FAQs: Healthcare Provider Network Analytics Essentials
Q: What is healthcare provider network analytics?
Healthcare provider network analytics is the systematic use of data science, statistical analysis, and business intelligence tools to evaluate provider network performance, optimize network composition, and improve healthcare delivery outcomes. It encompasses provider performance measurement across cost, quality, and satisfaction metrics, network utilization analysis revealing member access patterns, competitive intelligence comparing networks, predictive modeling forecasting gaps, and claims data analysis processing millions of transactions for actionable insights.
Q: How does network analytics differ from traditional network management?
Traditional network management relies on manual provider analysis, quarterly static reports, reactive problem-solving after issues surface, and spreadsheet-based tracking consuming staff time. Network analytics delivers automated insights through AI-powered algorithms, real-time dashboards showing current performance, proactive optimization identifying opportunities before problems occur, and self-service analytics enabling insights in three clicks rather than three weeks of manual work.
Q: What business results can organizations expect from implementing network analytics?
Organizations implementing comprehensive network analytics achieve typical 10% reduction in total medical cost through optimized network design balancing access, quality, and cost objectives. Advanced platforms enable building high-performing networks in minutes rather than months by exploring 100+ network configurations simultaneously. Analytics prevents regulatory compliance violations through continuous adequacy monitoring, improves member satisfaction through better provider matching, and enables strategic provider recruitment based on objective performance data.
Q: Which healthcare organizations use provider network analytics?
Health insurance payers including Medicare Advantage plans, commercial carriers, and Medicaid MCOs use network analytics for competitive positioning and cost management. Accountable Care Organizations managing provider performance under shared risk arrangements require analytics for value-based contracting. Benefits technology platforms including HR tech vendors and ICHRA administrators leverage analytics capabilities through API infrastructure. Provider organizations use network analytics to understand market position and negotiate contracts based on performance data.
Q: What are the core components of network analytics systems?
Core components include comprehensive claims data integration accessing Medicare, Medicaid, and Commercial datasets covering 300 million beneficiaries and 10 billion claims, provider performance analytics measuring cost efficiency and quality metrics, network adequacy and access analysis ensuring regulatory compliance, competitive intelligence revealing market positioning, predictive analytics and AI-powered optimization exploring network configurations, and interactive dashboards enabling self-service insights in as little as three clicks.
Q: How does network analytics support value-based care initiatives?
Network analytics enables value-based care by assessing provider quality using NCQA HEDIS measures or CMS MIPS scores, identifying providers contributing to 90th percentile quality performance for risk-sharing arrangements, supporting transparent performance measurement enabling objective shared savings calculations, and tracking outcomes and costs enabling continuous improvement in value-based programs. Analytics provides objective foundation for provider performance discussions replacing subjective assessments.
Q: What analytics use cases deliver the highest impact?
High-impact use cases include network design and optimization building high-performing networks maximizing medical cost savings while ensuring access, strategic provider recruitment identifying high-value providers based on performance data, leakage prevention tracking referral patterns keeping care within network, regulatory compliance management automating adequacy reviews, value-based care enablement identifying quality performers, and revenue optimization reducing expenses through data-driven network refinement.
Q: How does API infrastructure accelerate network analytics implementation?
API infrastructure provides real-time data access through unified connections to provider data sources, eliminating custom carrier integration work requiring 12-18 months per connection. Standardized provider data APIs deliver normalized information across 300+ carriers enabling analytics platforms to focus on insights rather than data acquisition. IdeonSelect provides comprehensive provider directories and network adequacy data via unified API, creating data foundation essential for analytics without requiring custom integration development.
Q: What should organizations consider when selecting network analytics platforms?
Evaluation criteria should emphasize data quality and breadth ensuring access to comprehensive Medicare, Medicaid, and Commercial claims datasets, AI sophistication enabling predictive modeling and automated optimization, user experience providing intuitive dashboards requiring minimal training, integration capabilities connecting to existing systems through APIs, scalability handling growing data volumes without performance degradation, and vendor domain expertise in healthcare analytics versus generic business intelligence tools.
Q: What is the recommended approach for starting network analytics adoption?
Organizations should start by defining specific business problems analytics should solve and establishing baseline metrics for measuring improvement. Access to comprehensive claims datasets covering all payer types provides analytical foundation. Starting with high-impact use cases including provider recruitment optimization, leakage prevention, or adequacy compliance demonstrates value quickly. Building cross-functional teams combining network management, clinical, actuarial, and data science expertise ensures insights translate to actionable strategies.
Q: How does the build-versus-buy decision work for network analytics?
Organizations face infrastructure choice: build analytics capabilities internally requiring significant data engineering investment, AI/ML expertise, ongoing maintenance, and 12-18 months development, or leverage existing platforms and API infrastructure deploying in weeks with subscription-based pricing and continuous vendor-managed updates. Internal builds require solving data acquisition, normalization, analytics algorithm development, and visualization challenges. Platform approaches provide comprehensive capabilities immediately with continuous improvements.
Q: What future capabilities are emerging in network analytics?
Emerging capabilities include increasingly sophisticated AI and machine learning for predictive modeling and automated recommendations, real-time analytics replacing periodic reporting with continuous monitoring, integrated care coordination linking network design to population health management, natural language processing extracting insights from unstructured data, and transparency tools supporting member decision-making with public provider performance data. Industry transformation toward value-based care accelerates analytics sophistication requirements.
Explore Ideon's IdeonSelect for health plans and benefits platforms
Ready to take the next step? See how Ideon works.
Provider Network Intelligence
Posted on by Ideon

Provider network analysis transforms network management from reactive problem-solving to proactive strategic planning through systematic evaluation of adequacy, competitive positioning, and optimization opportunities. Health plan executives recognize network analysis as top strategic priority in 2026, essential for regulatory compliance, member satisfaction, cost containment, and competitive differentiation. This guide explains what provider network analysis encompasses, how organizations leverage quantitative and qualitative methodologies to assess network performance, and why modern analytics platforms and API infrastructure enable rapid, sophisticated analysis that traditional manual approaches cannot deliver.
Healthcare payers face mounting pressure to demonstrate network adequacy, control costs, and differentiate competitively. Organizations conducting comprehensive provider network analysis identify adequacy gaps before regulatory violations occur, recruit high-value providers based on data rather than relationships, and optimize network composition for cost-effective care delivery. The strategic question: continue ad-hoc reactive network management consuming staff time without delivering actionable insights, or adopt systematic analysis transforming network strategy?
Traditional network management relies on quarterly spreadsheet reviews, relationship-based provider recruitment, compliance firefighting before audits, and subjective assessments lacking objective performance data. This approach produces networks with hidden adequacy gaps, regulatory risks from inadequate monitoring, missed competitive intelligence opportunities, and provider mix decisions based on availability rather than strategic value.
Provider network analysis operates differently. Systematic evaluation enables proactive adequacy monitoring, preventing violations, data-driven recruitment targeting underserved specialties and geographies, competitive benchmarking revealing differentiation opportunities, and performance-based optimization balancing cost and quality. Organizations face infrastructure decision: build analysis capabilities internally requiring data engineering investment and 12-18 months development, or leverage existing platforms and API infrastructure deploying in weeks.
Network analysis evolved from compliance exercise to strategic imperative as value-based care adoption accelerates and regulatory requirements intensify throughout 2026
What Is Provider Network Analysis?
Provider network analysis: The systematic evaluation of a health plan’s provider network to assess adequacy, competitive positioning, performance, and opportunities for optimization through data-driven methodologies.
Provider network analysis encompasses adequacy assessment evaluating whether networks meet regulatory standards including CMS network adequacy requirements and state-specific mandates while ensuring members have timely access to sufficient providers. Competitive benchmarking compares network composition against competitors in same markets revealing differentiation opportunities and strategic gaps. Geographic coverage evaluation analyzes provider distribution and member accessibility by region identifying areas where members face excessive travel burdens or limited specialty access.
Provider performance assessment measures quality metrics including clinical outcomes and evidence-based protocol adherence, cost efficiency showing total cost of care comparisons, satisfaction scores from member feedback, and utilization pattern analysis identifying appropriate versus unnecessary care. Utilization pattern analysis examines how members actually use networks through claims data, identifies out-of-network leakage patterns showing where members seek care outside contracted providers, determines root causes whether from inadequate networks or provider quality concerns, and calculates financial impact of out-of-network utilization.
Network composition review evaluates mix of primary care providers ensuring adequate access to routine care, specialist coverage across required taxonomies meeting regulatory minimums, hospital relationships providing geographic coverage, and ancillary services including labs, imaging, and therapy providers. Analysis ensures members can access comprehensive care without excessive out-of-network utilization driven by network gaps.
The purpose of provider network analysis centers on ensuring members have timely access to sufficient number and variety of healthcare providers enabling complete care delivery, meeting regulatory network adequacy standards from CMS, state agencies, and NCQA accreditation bodies, identifying areas for improvement to optimize provider accessibility and reduce costs, and enhancing member satisfaction through improved network design based on actual utilization patterns rather than assumptions.
Provider network analysis sits as foundation for data-driven network design and optimization decisions rather than relationship-based provider selection. It provides essential component of strategic planning for market expansion and product launches by demonstrating adequacy before entering new geographies. Analysis creates critical input for provider recruitment and contract negotiations by quantifying gaps requiring remediation. The architecture of provider networks influences everything from care access to profitability, making systematic analysis essential rather than optional.
Why Provider Network Analysis Matters
For Health Plan Executives
Network analysis emerged as top strategic priority for healthcare payer executives in 2026 based on Quest Analytics research revealing network design, evaluation, and optimization ranked as critical factors determining organizational success. Proactive approach to network analysis enables competitive advantage through strategic network composition rather than reactive problem-solving after members complain or regulators identify violations. Organizations investing in systematic analysis differentiate competitively while those relying on manual approaches struggle with hidden adequacy gaps.
Regulatory Compliance
Analysis ensures networks meet CMS network adequacy standards specifying time and distance requirements including 30 miles or 30 minutes for primary care in many jurisdictions, state-specific mandates varying by geography and line of business, and NCQA accreditation standards for Medicare Advantage and Commercial plans. Preventing costly penalties for inadequate networks or directory inaccuracies requires continuous monitoring rather than pre-audit scrambling. Supporting audit readiness with documented adequacy analysis creates regulatory confidence and reduces examination burden.
Member Satisfaction and Retention
Members expect timely access to quality providers within reasonable distances from homes and workplaces, creating satisfaction directly linked to network adequacy. Poor network adequacy leads to member complaints about limited provider choices, disenrollment during annual open enrollment periods, and plan switching to competitors with superior networks. Network accessibility directly impacts member experience scores including CAHPS surveys affecting Star Ratings and market reputation.
Cost Containment
Analysis identifies opportunities to improve cost-effectiveness while maintaining quality by revealing providers with high total cost of care for similar patient populations. Strategic network design reduces out-of-network utilization and associated balance billing, plan liability, and member dissatisfaction. Provider performance data enables targeted negotiations for favorable rates with high-performing, cost-efficient providers rather than accepting standard fee schedules.
Competitive Positioning
Understanding competitor networks through systematic analysis enables strategic differentiation showing where an organization’s network excels or requires strengthening. Analysis reveals market gaps competitors haven’t addressed creating recruitment opportunities for exclusive relationships. Competitive intelligence informs expansion strategies showing which geographies support growth and product positioning demonstrating network advantages to employers and brokers.
Operational Efficiency
Systematic analysis replaces ad-hoc, reactive network management consuming staff time on manual spreadsheet comparisons. Data-driven decisions reduce guesswork through objective performance metrics rather than subjective provider relationships. Analysis identifies redundancies where multiple providers serve the same small member population – enabling optimization, and opportunities for network refinement improving efficiency without compromising access.
Core Components of Provider Network Analysis
Member Distribution and Needs Assessment
Analyzing member demographics including age distribution affecting specialty needs, geographic locations showing population concentration, and healthcare needs based on chronic condition prevalence provides foundation for adequacy evaluation. Understanding demand for different provider types by region accounts for chronic conditions requiring endocrinologists or rheumatologists, age distribution driving pediatric or geriatric needs, and utilization patterns revealing actual member preferences. Mapping member population density identifies high-concentration areas requiring robust provider coverage versus rural areas with different access standards.
Provider Availability and Specialization
Evaluating availability and geographic distribution of providers by type and specialty ensures networks meet regulatory minimums. Analysis confirms networks include sufficient primary care providers serving as medical homes, specialists across required taxonomies meeting CMS and state standards, hospitals providing geographic coverage for acute care, and ancillary services enabling comprehensive care without out-of-network referrals. Assessing provider-to-member ratios against regulatory standards and industry benchmarks quantifies adequacy objectively.
Geographic Accessibility Metrics
Measuring driving distance and travel time from member locations to providers using mapping APIs determines whether networks meet time and distance standards. Dashboard analysis using driving distance assesses adequacy by specialty revealing geographic gaps. Identifying geographic areas where members face excessive travel burdens highlights recruitment priorities. Evaluating urban versus rural accessibility challenges recognizes different standards applying to dense versus sparse populations.
Appointment Accessibility Analysis
Collecting data on appointment availability and average wait times reveals whether providers with geographic coverage actually accept new patients. Segmenting by specialty and region identifies access bottlenecks where adequate provider counts mask appointment unavailability. Tracking “accepting new patients” status across network providers prevents ghost provider problems listing unavailable practitioners. Monitoring appointment scheduling patterns and capacity constraints shows whether providers can accommodate member volume.
Network Utilization and Out-of-Network Trends
Reviewing claims data analyzes member utilization patterns showing which providers members actually use versus directory listings. Identifying areas where members frequently seek out-of-network care reveals adequacy gaps requiring remediation. Determining root causes distinguishes lack of in-network options from provider quality concerns or accessibility issues. Calculating out-of-network leakage costs and frequency by specialty quantifies financial impact and prioritizes recruitment efforts.
Provider Performance Evaluation
Assessing quality metrics including clinical outcomes and evidence-based care adherence, cost efficiency comparing total cost of care against peers, member satisfaction scores from surveys and grievances, and utilization patterns by provider reveals performance variation. Comparing providers against peer groups and benchmarks controls for patient mix differences. Analyzing total cost of care and utilization patterns identifies high-performing versus underperforming network participants. Performance evaluation enables strategic decisions about contract renewals and tiered network designs.
Competitive Network Intelligence
Provider Network Scorecard capabilities efficiently assess competitive positioning and overall marketability score of Medicare Advantage networks comparing against competitors. Studying relative market rank and mapping enrollment impact through affiliated plans reveals competitive strength. Analyzing network composition breakdown including PCPs, hospitals, and specialists segmented by taxonomy shows competitive differentiation opportunities. Provider Network Comparison enables refined network-to-network comparisons revealing where competitors have superior coverage or where organization’s network excels
Network Analysis Methodologies and Approaches
Quantitative Analysis Methods
Provider-to-member ratios calculate numerical adequacy by specialty and geography showing whether sufficient provider capacity exists for member populations. Time and distance standards measure compliance with regulatory access requirements including 30 miles or 30 minutes for primary care and 60 miles or 60 minutes for specialists in many jurisdictions. Statistical modeling predicts network capacity needs based on member growth projections enabling proactive recruitment. Claims data analysis quantifies utilization patterns, costs, and out-of-network frequency providing objective performance metrics.
Qualitative Assessment Methods
Member feedback analysis through satisfaction surveys, grievances, and access complaints reveals actual member experience beyond quantitative metrics. Provider interviews understand panel capacity showing whether providers accepting new patients, practice capabilities indicating specialty scope, and referral patterns revealing care coordination effectiveness. Focus groups gather member perspectives on network adequacy and provider quality providing nuanced insights. Mystery shopping tests appointment availability and member experience firsthand validating directory accuracy.
Social Network Analysis for Care Transitions
Characterizing relationships among healthcare service providers in networks reveals care coordination patterns. Visualizing networks as diagrams of interconnected nodes shows care transition flows between hospitals, skilled nursing facilities, home health agencies, and outpatient providers. Identifying sender-receiver relationships that account for large proportion of community’s transitions highlights critical care pathways. Care transitions network diagrams depict flow enabling optimization of referral patterns and leakage prevention.
Geographic Information Systems
Heat maps displaying provider distribution and member population density visually identify coverage gaps. Drive-time analysis using mapping APIs including Google Maps and Mapbox calculates actual accessibility rather than straight-line distances. Visual identification of coverage gaps and access deserts highlights recruitment priorities geographically. Scenario modeling for provider recruitment impact shows adequacy improvements before executing contracts.
What-If Scenario Analysis
What-if approaches identify specific providers plans should recruit to improve network adequacy most efficiently. Simulating impact of adding providers on adequacy metrics prevents recruiting providers with minimal adequacy improvement. Modeling network composition changes before executing contracts reduces expensive recruitment mistakes. Evaluating cost-benefit of network expansion strategies balances investment against adequacy gains and competitive positioning.
Data Preparation and Integration
Methods to prepare data and compute drive time using tools like Tableau Prep and Google APIs standardize analysis. Integrating claims, enrollment, provider, and geographic data creates comprehensive analytical foundation. Standardizing and cleansing data ensures accurate analysis eliminating garbage-in-garbage-out problems. Proper data integration enables sophisticated analysis impossible with siloed data sources.
Key Analysis Use Cases and Applications
Network Adequacy Compliance
Demonstrating compliance with federal and state network adequacy regulations requires systematic analysis rather than periodic reviews. Generating regulatory reports documenting provider availability and access standards creates audit readiness. Identifying and remediating adequacy gaps before regulatory audits prevents violations and penalties. Analysis transforms compliance from reactive burden to proactive management discipline.
Strategic Provider Recruitment
Prioritizing recruitment efforts based on data-driven gap analysis focuses resources on highest-impact providers. Targeting high-value providers in underserved geographies or specialties addresses adequacy gaps efficiently. Building business case for contracting specific providers with projected impact metrics justifies investment. Data-driven recruitment replaces relationship-based approaches with objective performance criteria.
Market Expansion Planning
Analyzing adequacy of existing networks against populations of potential new members in expansion markets shows whether current providers support growth. Assessing the competitive landscape in target geographies reveals market dynamics and competitor strengths. Identifying providers needed to achieve adequate networks in new markets before expansion prevents costly market entry failures. Analysis enables confident geographic expansion decisions.
Product Development and Launch
Evaluating whether existing networks support new product offerings prevents launching products without adequate provider infrastructure. Designing networks tailored to specific member populations including ICHRA, small group, and individual market products requires analysis of specialty needs. Ensuring adequate specialty coverage for condition-specific products like diabetes management programs or oncology networks requires systematic assessment rather than assumptions.
Network Optimization
Identifying redundancies where multiple providers serve the same small member populations enables efficiency improvements. Optimizing provider mix based on utilization and performance data balances broad access with cost management. Balancing broad networks versus narrow high-performance networks based on strategic objectives requires analysis showing trade-offs. Optimization transforms networks from static provider lists to dynamic strategic assets.
Competitive Intelligence
Understanding competitor network strengths and weaknesses through systematic analysis reveals differentiation opportunities. Competitive intelligence informs positioning and marketing strategies showing network advantages to employers and consultants. Analysis enables proactive competitive responses rather than reactive catch-up efforts.
Modern Tools and Technology for Network Analysis
Advanced Analytics Platforms
Quest Analytics QES provides enterprise provider network performance management services enabling comprehensive adequacy assessment, competitive intelligence, and optimization analysis across all lines of business. HealthWorksAI NetworkIntel offers provider network analytics with scorecard and comparison capabilities revealing competitive positioning. ClarifyHealth delivers network optimization strategies leveraging advanced analytics and comprehensive claims data. Leading platforms integrate adequacy measurement, performance analytics, and competitive intelligence in unified solutions.
Visualization and Reporting Tools
Tableau dashboards enable measuring and improving network adequacy through interactive visualizations. Heat maps and geographic visualizations display provider distribution and member density intuitively. Customizable executive dashboards monitor network performance across key measures with real-time updates. Self-service analytics enable network managers to explore data independently without requiring data science expertise for every analysis.
API-Enabled Data Infrastructure
Real-time provider data access through unified APIs enables integration with claims systems, enrollment platforms, and provider directories. Normalized provider network data via standardized APIs accelerates analysis deployment by eliminating custom integration work. IdeonSelect provides comprehensive provider directories, network adequacy data, and specialty verification across 300+ carriers through unified API, creating data foundation essential for analysis without requiring carrier-by-carrier integration work consuming 12-18 months.
Data Sources for Analysis
Claims databases covering Medicare, Medicaid, and Commercial populations provide utilization and cost data. Provider directories and credentialing systems supply current practice information. Geographic and demographic databases enable accessibility analysis. Quality reporting systems including HEDIS, MIPS, and CAHPS provide performance metrics. Competitive intelligence databases reveal market positioning and competitor network composition.
Best Practices for Effective Network Analysis
Establish Regular Analysis Cadence
Conducting comprehensive network analysis at minimum annually ensures adequacy maintenance and strategic alignment. Quarterly reviews for high-growth markets or new product lines enable proactive gap identification. Continuous monitoring of key adequacy metrics through automated dashboards prevents violations between formal reviews. Regular cadence transforms analysis from periodic exercise to ongoing management discipline.
Integrate Multiple Data Sources
Combining quantitative metrics with qualitative member and provider feedback creates complete network understanding. Leveraging both internal data including claims and enrollment with external benchmarks provides context. Using competitive intelligence contextualizes findings showing relative performance rather than absolute metrics in isolation. Multi-source integration prevents data silos limiting analytical insights.
Focus on Actionable Insights
Translating analysis findings into specific recruitment targets and network strategies ensures analysis drives decisions rather than generating unused reports. Prioritizing gaps based on member impact and regulatory risk focuses resources effectively. Developing implementation roadmaps with clear timelines and accountabilities ensures follow-through. Actionable insights differentiate effective analysis from
Engage Cross-Functional Teams
Involving network management, medical management, compliance, and actuarial teams ensures analysis addresses real business problems. Clinical perspective in evaluating provider quality and adequacy prevents purely quantitative assessments missing quality concerns. Aligning analysis with broader organizational strategy and goals ensures network decisions support enterprise objectives. Cross-functional engagement bridges gap between analysis and action.
Leverage Technology and Automation
Using advanced analytics platforms streamlines analysis processes reducing manual effort. Automating data collection and reporting where possible frees staff for strategic work. Investing in visualization tools makes insights accessible to stakeholders without technical expertise. Technology investment multiplies analytical capacity without proportional headcount increases.
Document and Track Progress
Maintaining historical analysis results tracks network evolution over time showing improvement or deterioration. Documenting methodology ensures consistency and audit defensibility. Measuring impact of network changes implemented based on analysis findings validates analytical approaches. Documentation creates institutional knowledge surviving staff turnover.
How IdeonSelect Enables Provider Network Analysis
IdeonSelect delivers normalized provider network data through unified API infrastructure, creating the data foundation essential for comprehensive provider network analysis without requiring organizations to build hundreds of individual carrier integrations. The platform provides standardized provider directories, network adequacy validation, and specialty verification across 300+ insurance carriers, enabling analytics platforms to access clean, comprehensive provider data for performance analysis and competitive intelligence.
Technical Capabilities:
- Unified Data Access: Single API integration provides normalized provider data from 300+ carriers, eliminating custom carrier-by-carrier development requiring 12-18 months per integration
- Real-Time Updates: Automated refresh cycles ensure provider information reflects current network status including panel capacity and accepting new patients indicators without manual verification
- Comprehensive Provider Profiles: Practice locations with geographic coordinates for accessibility analysis, specialties and taxonomies for adequacy assessment, credentials for quality verification, network status across multiple carriers for competitive intelligence, panel capacity indicators showing provider availability
- Network Adequacy Data: Geographic coverage analysis supporting time and distance calculations, provider-to-member ratios by specialty and geography, specialty availability for regulatory compliance validation, competitive network comparison enabling benchmarking
- Analytics Integration: Clean, standardized data enabling analytics platforms to focus on insights rather than data acquisition and normalization infrastructure
Measurable Outcomes:
- Weeks implementation instead of 12-18 months building carrier data integrations from scratch
- 300+ carrier coverage through single API versus individual integration efforts requiring massive engineering investment
- Standardized data format eliminating ETL complexity and data quality issues plaguing custom integrations
- Continuous updates managed by Ideon ensuring analysis operates on current rather than stale data
- Analysis acceleration enabling organizations to deploy network analysis rapidly by providing data foundation
IdeonSelect enables benefits platforms, TPAs, health plans, and consultants to deploy provider network analysis capabilities by providing the clean, normalized, comprehensive provider data required for meaningful evaluation. Organizations focus analytical investments on deriving insights and optimizing networks rather than wasting resources on data acquisition infrastructure. This API-first approach transforms network analysis from multi-year data engineering projects into weeks-long analytical deployments.
The Future of Network Analysis
Advanced AI and Machine Learning
Increasingly sophisticated predictive models will forecast network adequacy gaps before regulatory violations enabling proactive remediation. Automated recommendations for provider recruitment will evolve from suggesting candidates to prioritizing based on projected adequacy improvement. Natural language processing will analyze unstructured member feedback and provider notes extracting insights currently trapped in text. Machine learning will identify utilization patterns predicting future needs based on member demographics and health trends.
Real-Time Analytics
Shift from periodic reporting to continuous monitoring will accelerate as streaming data architectures mature. Immediate alerts for network adequacy issues or provider performance changes will enable proactive responses before problems escalate. Live dashboards reflecting current network status will replace quarterly snapshots showing outdated information. Real-time analytics transforms network management from reactive discipline to proactive strategic function.
Integrated Network Strategy
Analytics linking network design to care management and population health will optimize entire care continuum rather than isolated network decisions. Member-provider matching based on outcomes data will improve satisfaction and clinical results. Closed-loop systems connecting analysis insights to recruitment and contracting actions will automate network optimization. Integration across network strategy, utilization management, and quality improvement creates synergies impossible with siloed functions.
Enhanced Competitive Intelligence
Public provider performance data will drive employer and consultant decisions requiring sophisticated competitive analysis. Analytics supporting value-based contracting and narrow network designs will accelerate differentiation. Increased focus on specialty networks for complex conditions will require targeted analysis capabilities. Competitive intelligence will shift from basic network comparisons to sophisticated strategic positioning analysis.
Organizations leveraging advanced provider network analysis build networks delivering superior member access, regulatory compliance, and competitive differentiation—positioning themselves for success in increasingly competitive healthcare landscape where network quality determines market share and profitability.
Final Words
Provider network analysis transforms network management from reactive problem-solving to proactive strategic planning through systematic evaluation of adequacy, competitive positioning, and optimization opportunities. Organizations implementing comprehensive analysis deliver measurable results including regulatory compliance preventing costly violations, targeted provider recruitment addressing gaps efficiently, competitive intelligence revealing differentiation opportunities, and optimized network composition balancing access, quality, and cost.
Health plan executives recognize network analysis as top strategic priority in 2026 based on Quest Analytics research showing network design, evaluation, and optimization as critical success factors. The performance gap widens as analytics-enabled organizations continuously refine networks using objective data while competitors rely on manual spreadsheet reviews and relationship-based recruitment. Analysis capabilities separate market leaders from laggards in competitive healthcare landscape.
Essential capabilities enabling network analysis success include member distribution and needs assessment showing where provider capacity is required, geographic accessibility metrics measuring compliance with time and distance standards, utilization pattern analysis revealing out-of-network leakage, provider performance evaluation enabling strategic decisions, and competitive network intelligence showing market positioning. Organizations must decide: build analysis infrastructure internally requiring significant data engineering investment and 12-18 months development, or leverage existing platforms and API solutions deploying in weeks.
Assessing current analysis capabilities reveals baseline performance and improvement opportunities. Organizations managing provider networks without systematic analysis miss adequacy gaps, recruitment opportunities, and competitive threats. Evaluating comprehensive analytics platforms including Quest Analytics, HealthWorksAI, ClarifyHealth, and API infrastructure solutions like IdeonSelect provides comparison against build-from-scratch approaches. Starting with high-impact use cases including adequacy compliance, strategic recruitment, or competitive intelligence demonstrates value quickly.
Building cross-functional teams translating analysis insights into network strategy ensures capabilities drive decisions rather than generating unused reports. Network management, medical management, compliance, and actuarial expertise working collaboratively transforms analysis from technical exercise to strategic advantage. Organizations treating analysis as compliance exercise rather than strategic planning fail to realize full value.
Effective provider network analysis enables data-driven decisions replacing intuition and relationships with objective performance measurement, proactive adequacy management preventing regulatory violations before audits, optimized provider networks balancing cost and quality through strategic composition, and competitive differentiation through superior network design—essential capabilities for thriving in modern healthcare landscape where network quality determines organizational success.
FAQs: Provider Network Analysis Essentials
Q: What is provider network analysis?
Provider network analysis is the systematic evaluation of a health plan’s provider network to assess adequacy, competitive positioning, performance, and opportunities for optimization. It encompasses adequacy assessment ensuring regulatory compliance, competitive benchmarking comparing network composition against competitors, geographic coverage evaluation analyzing provider distribution, provider performance assessment measuring quality and cost efficiency, utilization pattern analysis identifying out-of-network leakage, and network composition review evaluating provider mix across specialties.
Q: Why has network analysis become a strategic priority for health plan executives?
Network analysis emerged as top strategic priority for healthcare payer executives in 2026 based on Quest Analytics research showing network design, evaluation, and optimization as critical factors determining organizational success. Proactive analysis enables competitive advantage through strategic network composition, regulatory compliance preventing costly violations, member satisfaction through improved access, cost containment through optimization, and operational efficiency through data-driven decisions replacing ad-hoc manual processes.
Q: What are the core components of provider network analysis?
Core components include member distribution and needs assessment showing healthcare demand patterns, provider availability and specialization ensuring adequate coverage, geographic accessibility metrics measuring time and distance compliance, appointment accessibility analysis tracking panel capacity, network utilization and out-of-network trends identifying leakage, provider performance evaluation assessing quality and cost efficiency, and competitive network intelligence revealing market positioning through benchmarking.
Q: How does network analysis support regulatory compliance?
Analysis ensures networks meet CMS network adequacy standards including time and distance requirements, state-specific mandates varying by geography, and NCQA accreditation standards. Systematic analysis generates regulatory reports documenting provider availability and access standards creating audit readiness. Identifying and remediating adequacy gaps before regulatory audits prevents violations and penalties. Analysis transforms compliance from reactive firefighting to proactive management discipline with continuous monitoring.
Q: What methodologies are used in provider network analysis?
Methodologies include quantitative analysis methods using provider-to-member ratios, time and distance standards, statistical modeling, and claims data analysis; qualitative assessment methods incorporating member feedback, provider interviews, focus groups, and mystery shopping; social network analysis characterizing care transitions; geographic information systems displaying heat maps and drive-time analysis; what-if scenario analysis simulating recruitment impact; and data preparation integrating multiple sources.
Q: How does network analysis enable strategic provider recruitment?
Analysis prioritizes recruitment efforts based on data-driven gap identification showing which specialties and geographies require additional providers. Targeting high-value providers in underserved areas addresses adequacy gaps efficiently. Building business case for contracting specific providers with projected adequacy impact metrics justifies investment. Data-driven recruitment replaces relationship-based approaches with objective performance criteria focusing resources on highest-impact providers.
Q: What role does competitive intelligence play in network analysis?
Competitive intelligence through network scorecards assesses competitive positioning and marketability scores comparing Medicare Advantage networks. Analysis reveals competitor network strengths and weaknesses enabling strategic differentiation. Identifying provider overlap shows where competing for same providers versus building exclusive relationships. Competitive intelligence informs expansion strategies, product positioning, and marketing messages demonstrating network advantages to employers and consultants.
Q: How does API infrastructure accelerate network analysis implementation?
API infrastructure provides real-time provider data access through unified connections eliminating custom carrier integration work requiring 12-18 months per connection. Standardized provider data APIs deliver normalized information across 300+ carriers enabling analytics platforms to focus on insights rather than data acquisition. IdeonSelect provides comprehensive provider directories and network adequacy data via unified API, creating data foundation essential for analysis without requiring custom integration development.
Q: What are key use cases for provider network analysis?
Key use cases include network adequacy compliance demonstrating regulatory adherence, strategic provider recruitment prioritizing recruitment based on gaps, market expansion planning assessing network readiness for new geographies, product development evaluating network support for new offerings, network optimization identifying redundancies and improvement opportunities, and competitive intelligence understanding competitor strengths enabling strategic positioning.
Q: What best practices ensure effective network analysis?
Best practices include establishing regular analysis cadence with annual comprehensive reviews and quarterly updates, integrating multiple data sources combining quantitative metrics with qualitative feedback, focusing on actionable insights translating findings into recruitment targets, engaging cross-functional teams involving network management and clinical expertise, leveraging technology and automation streamlining processes, and documenting progress tracking network evolution and validating improvements.
Q: How does the build-versus-buy decision work for network analysis?
Organizations face infrastructure choice: build analysis capabilities internally requiring significant data engineering investment, ongoing maintenance, and 12-18 months development, or leverage existing platforms and API infrastructure deploying in weeks with subscription-based pricing and continuous vendor-managed updates. Internal builds require solving data acquisition, normalization, analytics algorithm development, and visualization challenges. Platform approaches provide comprehensive capabilities immediately with continuous improvements.
Q: What future capabilities are emerging in provider network analysis?
Emerging capabilities include advanced AI and machine learning for predictive modeling forecasting adequacy gaps, real-time analytics replacing periodic reporting with continuous monitoring, integrated network strategy linking analysis to care management and population health, enhanced competitive intelligence supporting value-based contracting and narrow network designs, and natural language processing extracting insights from unstructured member feedback and provider notes.
Explore Ideon's IdeonSelect for health plans and benefits platforms
Ready to take the next step? See how Ideon works.
CMS Provider Directory Requirements: A Complete Compliance Guide for 2026-2027
Posted on by Ideon

CMS provider directory requirements now mandate 85% accuracy, 30-day updates, and annual attestation for Medicare Advantage, Medicaid, and ACA marketplace plans. Beginning plan year 2027, provider directory data will appear publicly on Medicare Plan Finder, transforming accuracy from an internal compliance function into a competitive differentiator. Organizations that treat directory infrastructure as strategic investment gain compounding advantages over those relying on manual verification.
Provider directory accuracy faces federal scrutiny at an unprecedented level. CMS’s national review found that 48.74% of provider locations in Medicare Advantage online directories contained at least one inaccuracy—wrong phone numbers, incorrect addresses, or outdated patient acceptance status.
That failure rate persists despite the healthcare industry spending more than $2 billion annually to maintain provider data. Manual verification processes cannot keep pace with the velocity of provider information changes or the escalating demands of federal regulators.
The regulatory landscape has intensified dramatically. The No Surprises Act requires 90-day verification cycles and 2-business-day directory updates. The Consolidated Appropriations Act 2023 established baseline Medicaid directory standards. And the CMS Final Rule CMS-4208-F2, finalized September 2025, mandates that Medicare Advantage organizations submit provider directory data directly to CMS for publication on Medicare Plan Finder by 2027.
For health plans, benefits technology platforms, and ICHRA administrators, this convergence of requirements creates a clear decision point: build verification infrastructure internally—a 12-18 month undertaking requiring specialized HL7 expertise—or integrate API-driven compliance solutions that deliver accuracy, scalability, and automatic regulatory updates in weeks.
This guide breaks down every requirement organizations must meet across Medicare Advantage, Medicaid, and ACA marketplace programs, and examines how modern infrastructure transforms compliance from an operational burden into strategic advantage.
What are CMS provider directory requirements?
CMS provider directory requirements: Federal regulations mandating that Medicare Advantage plans, Medicaid programs, and ACA marketplace plans maintain accurate, publicly accessible provider directories. These requirements specify what information organizations must include, how frequently they must verify it, and the consequences of non-compliance.
What directories must include. Provider identification details—name, National Provider Identifier (NPI), specialty, and board certifications—form the foundation. Practice location data encompasses physical addresses, phone numbers, and fax numbers. Accessibility information covers facility accommodations for individuals with physical disabilities. Service delivery details specify telehealth availability. Patient acceptance status indicates whether a provider accepts new patients. Cultural and linguistic capabilities include languages spoken, American Sign Language availability, and interpreter services. Network participation data encompasses network status, plan affiliations, and tier designations.
Who must comply. Medicare Advantage organizations offering coverage to Medicare beneficiaries face the most stringent standards. Medicaid managed care programs—including state Medicaid and CHIP agencies—must meet CAA 2023 requirements. ACA marketplace plans offering qualified health plans on federal and state exchanges face parallel accuracy obligations. Benefits technology platforms—ICHRA administrators, broker platforms, and HR tech vendors distributing these plan types—inherit compliance exposure through their carrier relationships.
The regulatory evolution. Three milestones define the current landscape. The Consolidated Appropriations Act 2023 established baseline provider directory standards for Medicaid and CHIP programs. CMS Final Rule CMS-4208-F2, finalized September 19, 2025, mandated Medicare Plan Finder integration for plan year 2027. The November 2025 CMS Technical Implementation Guide specified data formats, submission protocols, and implementation timelines.
CMS provider directory accuracy standards
The 85% accuracy threshold. CMS requires a minimum 85% directory accuracy rate for Medicare Advantage and ACA marketplace plans. Accuracy measurements span practice locations, phone numbers, specialty designations, and network participation status. Failing to meet the 85% threshold triggers regulatory action, corrective measures, and potential enrollment freezes.
National accuracy challenges. The gap between the 85% requirement and current performance remains significant. CMS’s national review found that 48.74% of provider locations in MA online directories had at least one inaccuracy. The most common errors include wrong phone numbers, incorrect addresses, and outdated acceptance status. Industry data indicates that only one in five health plans has achieved significant accuracy improvements despite dedicated verification efforts.
Location accuracy as critical challenge. CMS data shows that at least 45% of locations reported in directories are incorrect, with the most common issue being providers not actually practicing at published locations. Location-specific verification requires providers to accept or reject location information and provide reasons for rejections—a process that manual outreach cannot execute efficiently at scale.
CMS testing and monitoring. CMS conducts quarterly secret shopper surveys without advance warning to health plans. Random provider sampling across entire networks tests for discrepancies in contact information, location accuracy, and patient acceptance status. Monthly directory updates represent the minimum compliance obligation.
What CMS considers “accurate.” Five criteria define an accurate directory entry: the provider actively practices at the listed location; contact information (phone, fax, email) functions and remains current; specialty and credential information reflects verification against primary sources; network participation status reflects current contracts; and patient acceptance status meets required update timeframes.
Medicare Plan Finder integration for 2027
The 2027 mandate. Beginning plan year 2027, all Medicare Advantage organizations must submit provider directory data directly to CMS for publication on Medicare Plan Finder (MPF). This rule, finalized September 19, 2025 under CMS-4208-F2 and codified at 42 C.F.R. § 422.111, establishes four core obligations: make provider directory information available to CMS for publication online; submit data in a format, manner, and at times determined by CMS; update provider directory information within 30 days of becoming aware of any change; and attest at least annually that all submitted information is accurate and complete.
Implementation timeline. As of January 1, 2026, MA organizations must make directory data available to CMS. During 2026, CMS conducts validation testing to ensure directory data accurately reflects MA organization submissions. For the 2026 Plan Finder update, CMS partnered with SunFire Matrix, Inc. to populate provider details using third-party data sources, establishing a benchmark for data completeness and reliability. By the 2027 open enrollment period, provider directories sourced directly from MA organizations appear publicly on Medicare Plan Finder.
CMS issued the provider directory requirement through a separate final rule to provide MA plans “maximum lead time” for preparation. That lead time narrows with each passing quarter.
Why this integration matters. This mandate transforms provider directory accuracy from an internal audit metric into a public-facing quality indicator. Beneficiaries compare provider networks across all MA plans on a single platform for the first time. Directory quality directly affects plan selection, member trust, and competitive positioning. Plans with incomplete or inaccurate data visible on Medicare Plan Finder face reputational consequences that compound through lower enrollment.
Data format and technical submission requirements
FHIR-based API standard. CMS requires the Health Level Seven International (HL7) FHIR standard for provider directory APIs. MA organizations have maintained provider directory APIs since July 1, 2021, under the Interoperability and Patient Access Final Rule. For Medicare Plan Finder integration, CMS accepts data via MA plans’ existing FHIR-based JSON APIs—aligning the submission standard with infrastructure that compliant organizations already operate.
National provider directory vision. CMS intends for the National Provider Directory, once fully implemented, to consume MA plan FHIR-based APIs directly. Data feeds to Medicare Plan Finder enable real-time provider information updates across all plans. The November 2025 CMS Technical Implementation Guide provides specifications for data formats, submission protocols, and timing milestones.
Required data elements. CMS requires all information described in § 422.111(b)(3)(i): provider identification and credentials, all practice locations with contact information, network participation and tier status, accessibility and telehealth capabilities, patient acceptance status, and cultural and linguistic accommodations. Each data element must meet the format specifications outlined in the November 2025 CMS Technical Implementation Guide, which organizations must follow when making provider information available.
Consistency between submissions. CMS did not finalize the proposal requiring direct attestation that directory data matches network adequacy submissions. However, plans must maintain consistency between the two. Discrepancies between provider directory submissions and Health Service Delivery (HSD) network filings trigger compliance review and audit exposure.
Medicaid and ACA marketplace directory requirements
CAA 2023 requirements. The Consolidated Appropriations Act 2023 requires both fee-for-service (FFS) and managed care Medicaid programs to update network provider directories quarterly. Directories must include each provider’s name, address, phone number, and specialty. Medicaid directories carry additional data requirements: facility accommodations for individuals with physical disabilities, provider website URLs, telehealth availability, whether providers accept new Medicaid or CHIP patients, and American Sign Language availability along with other cultural and linguistic capabilities.
State agency obligations. State Medicaid and CHIP agencies providing FFS services must incorporate required information into provider directories. Enhanced federal financial participation supports the design, development, implementation, and maintenance of state Medicaid IT systems for FFS provider directories.
30-day update requirement. Medicaid managed care programs must update directories within 30 days of becoming aware of changes. This requirement took effect July 1, 2025, for Medicaid CAA compliance.
ACA marketplace standards. ACA marketplace plans face the same 85% accuracy threshold as Medicare Advantage plans. Monthly update cycles represent the minimum obligation. CMS conducts secret shopper testing without advance notice across marketplace plans, applying the same verification methodology used for MA directory reviews.
Corrective action plans. CMS July 2024 guidance established corrective action plan requirements for organizations failing to meet directory accuracy standards. These procedures outline the steps for returning to compliance after directory accuracy failures, including documentation requirements and remediation timelines.
Enforcement mechanisms and penalties
Escalating penalty structure. CMS enforces directory accuracy through a progressive framework. Warning letters represent the initial enforcement action. Corrective action plans follow for organizations failing the 85% threshold. Repeated failures trigger enrollment freezes—stopping new member acquisition during critical growth periods. Plan termination remains a possibility for organizations demonstrating persistent non-compliance.
Audit landscape. At least half of surveyed health plans reported audits since January 2016, when CMS directory regulations took effect. Among those audited, nearly 70% measure directory accuracy quarterly or monthly. The audit landscape intensifies with Medicare Plan Finder integration: beginning 2027, directory accuracy becomes publicly visible, enabling beneficiaries to directly assess provider network quality when comparing plans.
Financial impact. Non-compliance creates cascading costs: regulatory penalties and fines, accelerated member disenrollment, reputational damage in competitive markets, and increased call center volume addressing member complaints from directory errors. For organizations operating in multiple states, the compounding effect of multi-jurisdictional non-compliance accelerates these costs further.
Public accountability through Medicare Plan Finder. Beginning 2027, directory accuracy becomes publicly visible on Medicare Plan Finder. Beneficiaries directly assess provider network quality when comparing plans, making poor directory accuracy a measurable competitive disadvantage in a transparent marketplace.
Documentation obligations. MA organizations must attest annually to directory accuracy, maintain audit trails demonstrating continuous monitoring, and document all verification processes and update procedures.
Compliance challenges and operational burden
Resource-intensive manual verification. Provider practices field outreach from multiple health plans, all seeking the same information through different channels and timelines. Health plans allocate significant resources to phone, mail, and fax outreach—efforts that collectively account for a portion of the $2 billion the commercial healthcare industry spends annually maintaining provider data. Only one out of five health plans has achieved significant improvements from these verification efforts.
Data fragmentation. Provider information scatters across credentialing, enrollment, claims, and directory systems with no single source of truth. Inconsistencies compound as data ages. Batch processing creates delays between provider changes and directory updates—delays that regularly exceed regulatory timelines.
Provider engagement difficulties. Low response rates to verification outreach persist across the industry. Providers lack direct incentive to prioritize directory update requests among competing administrative demands. Multi-plan coordination—where providers must respond to verification requests from every health plan in their network—creates confusion and incomplete responses. Without a standardized process, information updates submitted to one plan do not automatically propagate to all relevant plans.
Technical barriers. FHIR API implementation requires specialized HL7 expertise that many organizations lack internally. Legacy systems may not support real-time data exchange. The 2027 Medicare Plan Finder deadline compresses implementation timelines for organizations that have not yet built compliant infrastructure. Testing and validation periods add further complexity to an already constrained compliance timeline.
Regulatory timeline pressures. The 30-day update requirement proves difficult to achieve with manual processes. Annual attestation obligations demand continuous accuracy monitoring rather than point-in-time corrections. The convergence of the 2027 Medicare Plan Finder deadline with existing No Surprises Act requirements creates overlapping compliance obligations that strain operational capacity.
Modern compliance solutions and best practices
Centralized provider data platforms. A single source of truth eliminates the inconsistencies that plague distributed systems. Providers update information once, and changes propagate to all participating health plans automatically. CAQH DirectAssure demonstrates this model: leveraging data from CAQH ProView, conducting provider outreach aligned with regulatory reporting requirements, and enabling providers to review, update, and attest to practice information shared with all participating plans.
The results from centralized approaches are measurable. One health plan achieved 84% directory accuracy for Medicare Advantage plans using the CAQH solution—far exceeding the national average of 50% or lower. Nearly 40,000 providers completed profiles and attested to accuracy within three months, with a Net Promoter Score of 70 indicating strong provider preference for automated workflows over manual outreach.
API-driven compliance infrastructure. Real-time data exchange replaces batch processing and manual outreach. FHIR-based APIs meet CMS technical requirements for the National Provider Directory and Medicare Plan Finder integration. Automated verification against primary sources—NPPES, medical boards, DEA registries—replaces phone calls and fax surveys. Continuous monitoring identifies changes and triggers update workflows within regulatory timeframes.
Implementation considerations. Organizations face a clear build-versus-integrate decision. Building FHIR API infrastructure internally requires specialized HL7 expertise, 12-18 months of development, and ongoing maintenance as CMS requirements evolve. Integrating third-party compliance platforms accelerates time-to-compliance through subscription models that include automatic regulatory updates. For organizations approaching the 2027 Medicare Plan Finder deadline, timeline alone often determines the path.
Location-specific validation. Enhanced verification functionality addresses CMS’s identified location accuracy challenge. Location-specific questions require providers to accept or reject location information and provide reasons for rejections. This approach enables health plans to reconcile discrepancies systematically—addressing the most persistent compliance failure point in CMS audit findings.
How Ideon addresses CMS directory compliance
IdeonSelect delivers normalized provider directory data through a unified API, providing the infrastructure layer that health plans, ICHRA administrators, and benefits technology platforms need to meet CMS directory requirements without building verification systems from scratch.
- Unified provider data access: Single API integration provides access to provider networks across 300+ carriers, eliminating the need to build and maintain individual carrier connections for directory data
- Real-time provider search: Normalized provider data—specialties, locations, credentials, network status—meets CMS accuracy and timeliness requirements through continuous data updates
- Compliance-aligned update cycles: Automated verification workflows align with CMS 30-day, quarterly, and annual requirements, ensuring directory accuracy meets the 85% threshold
- FHIR-compatible architecture: Infrastructure designed for interoperability supports Medicare Plan Finder integration timelines and CMS technical submission requirements
- Enterprise-grade security: SOC 2 Type II certified and HIPAA compliant infrastructure removes months of compliance certification work
For benefits technology platforms distributing Medicare Advantage, Medicaid, or ACA marketplace plans, IdeonSelect enables compliant provider search without building verification infrastructure internally. The 4-8 week implementation timeline supports organizations preparing for the 2027 Medicare Plan Finder deadline—while competitors spend 12-18 months building the same capabilities from scratch. Automated compliance monitoring and multi-carrier integration through a single API reduce the operational burden that manual verification processes impose on health plan and provider staff alike.
Final words
CMS provider directory requirements have evolved from periodic audit exercises into continuous compliance obligations with public accountability. The 2027 Medicare Plan Finder mandate transforms directory accuracy from an internal metric into a competitive differentiator visible to every Medicare beneficiary comparing plans.
Manual verification cannot achieve the accuracy, timeliness, or scale these requirements demand. Organizations using centralized API platforms achieve 84% directory accuracy versus the 50% national average, while reducing operational burden and compliance risk.
The decision is straightforward: build specialized FHIR infrastructure internally over 12-18 months, or integrate proven API solutions that deliver compliant provider data in weeks. Organizations that act now position themselves to meet 2027 deadlines and convert directory accuracy into a member trust advantage.
Explore Ideon's IdeonSelect for health plans and benefits platforms
Ready to take the next step? See how Ideon works.